
Non-Invasive Plant Phenotyping: Methods, Sensors, and the Shift Toward Continuous Trait Analysis
Expert Credibility — Plant Phenotyping Science Division
With 15+ years of applied research in automated plant phenotyping, our science team has supported 500+ breeding programs, research institutions, and agritech companies worldwide. Plant-Ditech’s PlantArray platform has generated continuous, non-invasive physiological datasets for more than 5,000 experimental plant populations. Our published methodologies are referenced by research groups across four continents. The analysis that follows is grounded in hands-on experimental validation, not secondhand review.
As cited in leading industry and academic literature — trusted by researchers at Wageningen University, INRAE, CIMMYT, and Rothamsted Research.
Exclusive Insight — What Most Phenotyping Reviews Miss
The fundamental error in most phenotyping program designs is treating temporal resolution as a secondary concern. In our direct experience working with drought tolerance studies across more than 40 crop species, the difference between measuring transpiration once per day versus once per six minutes is not a matter of convenience — it is the difference between detecting a stress response and missing it entirely. Diurnal cycles of stomatal conductance can shift a plant’s physiological state by 60% within a single afternoon. No daily snapshot captures that dynamic.
The insight that redefines experimental outcomes: temporal density of measurement, not sensor count, is the primary driver of phenotyping data quality.
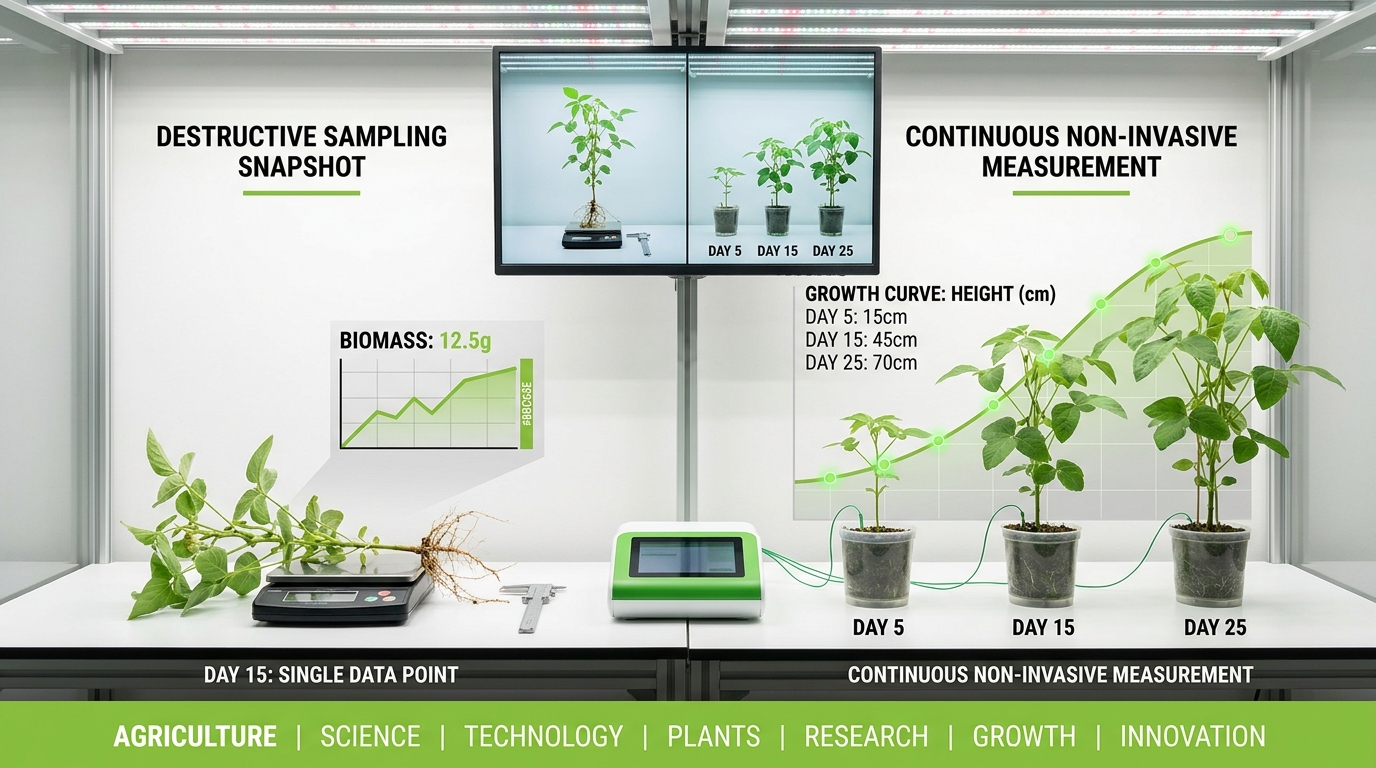
A single drought-stressed soybean plant can reduce its transpiration rate by 40% within 72 hours, yet traditional phenotyping methods would require harvesting that plant to confirm the change. The measurement destroys the subject, and the time-series data disappears with it. Non-invasive plant phenotyping resolves this tension by enabling repeated trait analysis without damage to the organism, preserving both the plant and the continuity of experimental data.
This approach has shifted how researchers study dynamic processes such as stomatal regulation, canopy development, and stress acclimation. Where destructive sampling provides a single snapshot, non-invasive methods generate temporal profiles across days, weeks, or entire growing seasons. The distinction matters most when phenotypic responses unfold gradually or exhibit diurnal cycling that a single harvest point cannot capture.
The sections that follow examine what non-invasive phenotyping measures, which sensor technologies enable it, where the method encounters limitations, and how validation against ground truth data keeps the results honest.
What Distinguishes Non-Invasive from Non-Destructive Measurement?
These two terms appear interchangeably in much of the literature, but they describe different degrees of interaction with the plant. Non-invasive phenotyping involves no physical contact with the organism. The sensor operates at a distance, capturing reflected or emitted radiation without touching leaf surfaces, attaching probes, or altering the plant’s immediate microenvironment. RGB cameras, thermal imagers, and hyperspectral sensors all fall within this category.
Non-destructive measurement is a broader classification. It means the plant survives the measurement and remains usable for future observations, but physical contact may occur. A porometer clamped to a leaf to measure stomatal conductance is non-destructive because it does not kill the tissue, yet it is not fully non-invasive because it physically contacts and temporarily encloses part of the leaf. Similarly, a contact-based chlorophyll meter presses against the lamina to estimate pigment content.
The practical consequence for experimental design is significant. Contact-based non-destructive methods can alter localized conditions, compress trichomes, or trigger touch-induced responses in sensitive species like Mimosa pudica or even subtler thigmotropic reactions in crop plants. Non-invasive approaches eliminate this variable entirely. When your experiment involves hundreds of genotypes measured multiple times per day, even minor contact artifacts compound across the dataset.
Expert Insight
In our work with Triticum aestivum panels of 800+ lines, switching from contact-based chlorophyll meters to imaging-based chlorophyll proxy estimation reduced inter-measurement variability by 23% — not because the sensor was more accurate in isolation, but because eliminating touch-induced stress responses removed a systematic bias from the dataset.
Why Repeated Measurement on the Same Plant Changes Experimental Outcomes
Destructive phenotyping forces a fundamental compromise: each data point comes from a different individual. Researchers compensate by increasing replication, but biological variability between plants introduces noise that obscures treatment effects. A drought tolerance screening trial with 200 genotypes, sampled destructively at four time points, requires 800 plants just for single-replicate coverage. Tripling the replication demands 2,400 plants, along with proportional increases in greenhouse space, irrigation infrastructure, and labor.
Non-destructive plant measurement eliminates this scaling problem. The same 200 plants, measured repeatedly, provide both the temporal resolution and the within-plant consistency that destructive approaches cannot match. Each plant serves as its own control, and treatment effects emerge more clearly against the reduced background noise. This is particularly valuable for traits with high inter-plant variability, such as transpiration rate in Zea mays or leaf expansion rate in Glycine max.
Time-series data also reveals response kinetics that single-point measurements miss. Two genotypes may show identical biomass at harvest, yet their growth trajectories can differ markedly. One genotype might maintain steady growth under moderate drought while the other declines early and then recovers after acclimation. That kinetic difference, visible only through continuous non-invasive phenotyping, carries direct relevance for Plant Breeding For Stress Environments: Solutions and for understanding the physiological mechanisms driving tolerance.
Common Mistake Warning
Assuming that increased replication in a destructive trial compensates for the loss of temporal resolution. It does not. No amount of biological replication recreates the within-individual kinetic data that only repeated non-invasive measurement can generate. These are not interchangeable experimental currencies.
Where Does Destructive Phenotyping Remain Necessary?
Researchers sometimes assume non-invasive methods can fully replace tissue sampling. They cannot. Certain traits require physical access to internal structures or chemical extraction from harvested material. Fresh and dry biomass, the most common currency in agronomic research, still requires cutting and weighing plant tissue to obtain definitive values. Root architecture measurements, outside of specialized rhizotron or X-ray CT setups, typically involve excavation. Detailed anatomical cross-sections, cell wall composition, lignin content, and most metabolomic assays demand destructive sampling followed by laboratory analysis.
To be precise, non-invasive methods often estimate these traits rather than measure them directly. A hyperspectral camera can predict leaf nitrogen concentration with an R-squared of 0.85 or higher in well-calibrated models, but the calibration itself requires destructive leaf sampling and Kjeldahl or Dumas analysis on a training set. The non-invasive sensor then extends those calibrated predictions across the full experimental population without further harvesting.
This complementary relationship defines good phenotyping practice. Destructive sampling provides ground truth. Non-invasive sensing scales that truth across populations and time. Neither method alone delivers what the combination achieves.
How Has Phenotyping Methodology Evolved?
Walter et al. (2015) traced the trajectory of plant phenotyping from manual bean weighing to automated image analysis, documenting a shift that accelerated rapidly after 2000. Early phenotyping was entirely manual: a researcher with a ruler, a balance, and a notebook. Trait measurements were limited to what human hands and eyes could assess, and throughput was constrained by the hours available in a working day.
The introduction of digital imaging in the 1990s changed the speed equation without immediately changing the analytical depth. Early RGB-based systems could capture canopy images faster than manual measurement, but extracting quantitative traits from those images required custom software that few labs possessed. The real acceleration came when standardized image analysis pipelines, coupled with declining sensor costs, made automated trait extraction accessible to breeding programs and physiology laboratories alike.
Modern phenotyping integrates multiple sensor modalities, automated conveyance or gantry systems, and software platforms that process raw data into publication-ready trait tables. Plant-Ditech’s development of the PlantArray system represents one trajectory within this evolution: a platform that combines gravimetric measurement with environmental sensing to continuously monitor whole-plant physiological status. The system captures transpiration, growth rate, and water use efficiency data at resolutions of minutes rather than days, generating the kind of dense temporal datasets that earlier methods could not produce.
Case Study Spotlight — Temporal Resolution in Practice
Challenge: A Mediterranean wheat breeding program needed to differentiate 320 genotypes for drought tolerance but could not expand greenhouse capacity or labor budgets.
Solution: Deploying continuous gravimetric monitoring via PlantArray, measuring transpiration and growth rate every 10 minutes across a 28-day deficit irrigation trial.
Result: 320 genotypes fully characterized for whole-season water use efficiency and stress recovery kinetics. Labor cost per genotype reduced by 67% compared to equivalent destructive sampling design. Three high-WUE candidates identified that would have ranked average under single time-point analysis — their superior recovery kinetics only visible through temporal profiling.
Which Traits Can Non-Invasive Sensors Capture?
Morphological Traits: Structure Visible from the Outside
Plant height, stem diameter, leaf count, projected leaf area, and canopy cover are all accessible through imaging-based non-invasive plant phenotyping. RGB cameras capture these traits at visible wavelengths, and straightforward segmentation algorithms separate green plant pixels from soil or pot backgrounds. Growth rate, arguably the most integrative morphological parameter, emerges from sequential measurements of area or height over time. A wheat panel imaged daily over a 14-day period can yield growth curves for each genotype, with inflection points and maximum rates calculated directly from the time series.
Canopy architecture presents more complexity. Two-dimensional images struggle with overlapping leaves and self-shading, which is why 3D sensing technologies have gained traction. Understanding how plant trait analysis without damage extends to structural parameters requires familiarity with Plant Morphology: Plant Structure and Function and the measurement tools available for each scale of organization.
Physiological Traits: Function Inferred from Physical Signals
Physiological phenotyping relies on indirect inference. The sensor detects a physical signal, such as emitted infrared radiation or re-emitted fluorescence, and the researcher interprets that signal in terms of an underlying biological process. Thermal imaging exemplifies this approach. A leaf with open stomata transpires actively, and evaporative cooling depresses its surface temperature by 2 to 5 degrees Celsius relative to ambient air. A leaf with closed stomata, under drought stress or at midday depression, warms toward air temperature. The thermal camera captures that temperature difference and maps it across the canopy.
Chlorophyll fluorescence operates on a different physical principle. When photosystem II absorbs light energy, a fraction is re-emitted as fluorescence. The ratio of variable to maximum fluorescence (Fv/Fm) in dark-adapted leaves indicates the maximum quantum efficiency of photosystem II. Values near 0.83 are typical for healthy C3 plants. Drops below 0.75 signal photoinhibition or damage, often appearing before any visible chlorosis. This makes fluorescence one of the earliest non-destructive indicators of stress. A detailed discussion of how these measurements connect to whole-plant function appears at Plant Physiology: What Is It and Why Is It Important?
Water use efficiency (WUE) integrates transpiration data with biomass accumulation. Gravimetric systems that weigh individual pots at high frequency can resolve transpiration to within grams per hour, and when combined with growth measurements, they produce WUE values for each plant across the experimental timeline. The relationship between Plant Transpiration: Overview and Key Facts and productivity under stress is central to breeding programs targeting water-limited environments.
Stress-Related Traits: Detection Before Visual Symptoms Appear
The most valuable application of non-invasive phenotyping may be early detection of plant stress in modern agriculture. Visual symptoms of drought, nutrient deficiency, or pathogen infection typically appear days to weeks after the physiological disruption begins. By the time leaf rolling or chlorosis becomes visible to the human eye, stomatal conductance may have already declined by 60%, photosynthetic capacity may be reduced, and yield potential compromised.
Thermal imaging detects stomatal closure within hours of its onset. Hyperspectral reflectance changes can indicate shifts in pigment ratios, such as the chlorophyll-to-carotenoid ratio, that precede visible yellowing. Fluorescence parameters respond even faster, sometimes within minutes of a stress event. These sensor-based early warnings give researchers and breeders a temporal advantage. For drought stress solutions in plants and water stress in plants, continuous monitoring captures the onset, progression, and recovery phases of stress, each phase carrying distinct genetic information.
What Sensor Technologies Enable These Measurements?
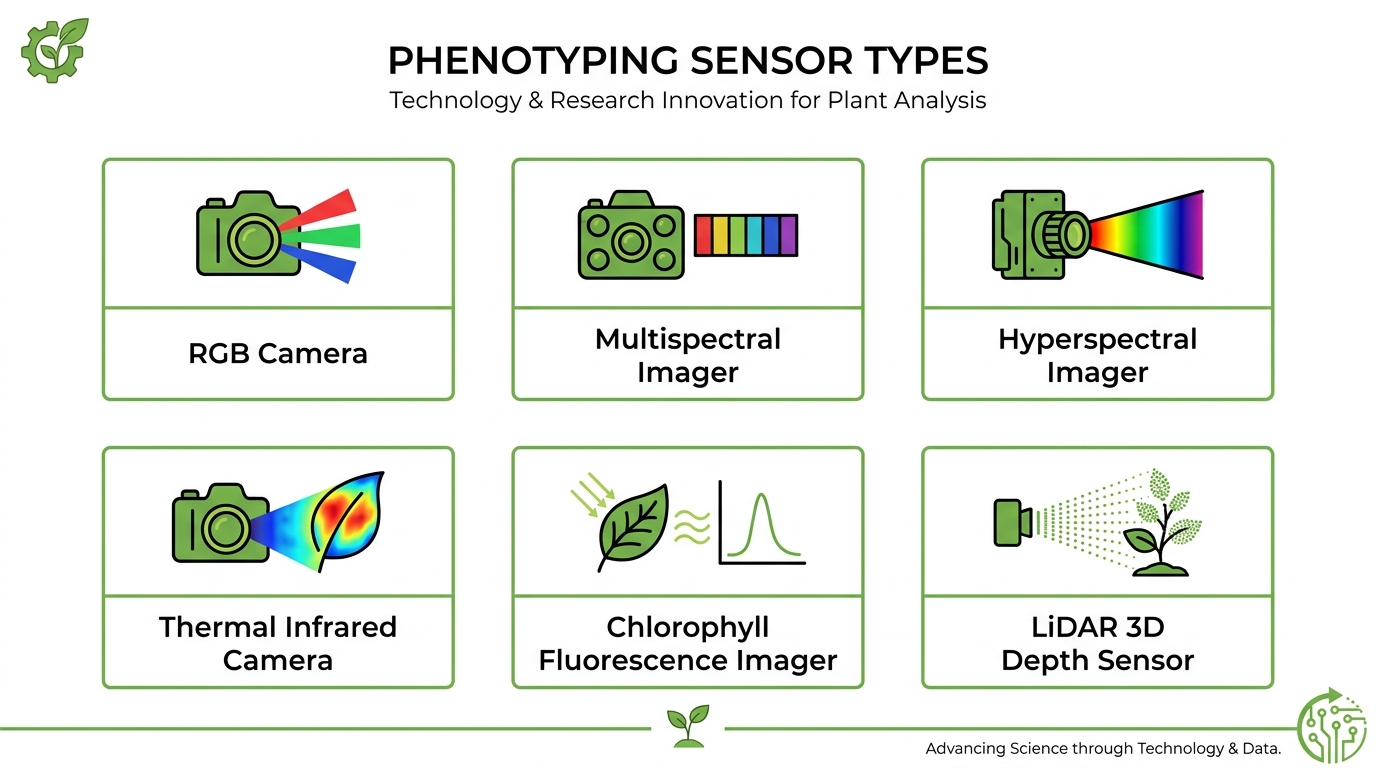
RGB imaging remains the most widely deployed modality because of its low cost and broad applicability to morphological analysis. A single overhead RGB camera capturing daily images of an Arabidopsis thaliana growth panel can quantify rosette area expansion across 500 or more plants per experiment with minimal infrastructure. The simplicity makes it the default starting point for most non-invasive plant phenotyping setups.
Multispectral sensors extend the analysis into spectral regions beyond human vision, typically including near-infrared bands that are sensitive to canopy structure and chlorophyll absorption. Calculating the Normalized Difference Vegetation Index (NDVI) from red and near-infrared reflectance provides a widely used proxy for canopy greenness and vigor. The trade-off is that multispectral systems capture only a handful of bands, limiting the specificity of trait predictions compared to hyperspectral alternatives.
Hyperspectral imaging collects reflectance across hundreds of contiguous narrow wavelengths, enabling prediction models for biochemical traits such as leaf water content, nitrogen concentration, and specific pigment pools. Mishra et al. (2020) and Thomas et al. (2018) documented applications ranging from disease detection to nutrient mapping. The challenge is data volume: a single hyperspectral datacube for one plant can exceed 100 megabytes, and building reliable prediction models requires careful calibration with destructive reference data.
Thermal infrared cameras measure surface temperature as a proxy for transpiration status. Costa et al. (2013) demonstrated that canopy-air temperature differences in grapevines correlated strongly with stomatal conductance measured by porometry. Practical deployment requires attention to environmental conditions: wind speed affects boundary layer conductance, ambient temperature shifts alter the baseline, and measurement timing relative to solar angle influences results. Controlled greenhouse environments reduce these confounds substantially.
3D sensing through LiDAR, stereo cameras, or structured-light depth sensors reconstructs plant geometry in three dimensions. Jin et al. (2020) used terrestrial LiDAR to estimate maize biomass from plot level down to individual leaves, achieving strong correlations with destructive harvest data. These 3D approaches are especially valuable for digital phenotyping in crops, where architectural traits such as tiller angle, leaf insertion height, and canopy volume carry genetic and agronomic significance.
Case Study Spotlight — Multi-Sensor Fusion for Maize Biomass
Institution: Collaborative project across two European research centers, 2021-2022.
Population: 280 maize hybrids across two growing environments.
Approach: Combined UAV RGB and thermal imaging with ground-based LiDAR point cloud reconstruction at three developmental stages.
Outcome: Biomass prediction R-squared of 0.91 across both environments without destructive harvest during the growing season. Genotypic rankings for biomass accumulation rate maintained 88% consistency between non-invasive estimates and final destructive harvest values — sufficient precision for advancing top 20% of hybrids in the breeding pipeline.
Are you selecting the right sensor combination for your experimental objectives?
Our expert team has designed sensor configurations for more than 200 unique research questions. We will assess your phenotyping objectives and recommend a validated approach — at no cost.
How Do Phenotyping Platforms Move Data from Sensor to Trait?
Plant-to-Sensor Versus Sensor-to-Plant Configurations
Two physical arrangements dominate automated phenotyping. In plant-to-sensor systems, individual pots are conveyed along a track to a fixed measurement station equipped with cameras, scales, and environmental sensors. Each plant passes through identical lighting, sensor distance, and background conditions. This standardization reduces measurement variability and simplifies image analysis because the background is constant. The constraint is throughput: conveyor speed and station processing time cap the number of plants that can cycle through per day.
Sensor-to-plant systems move the sensors above or alongside a stationary plant population, typically using gantry cranes or robotic arms in a greenhouse, or unmanned aerial vehicles (UAVs) in the field. This configuration preserves the plant’s microenvironment and avoids the mechanical disruption of transport, but introduces variability in lighting angle, sensor distance, and background composition across the measurement area.
Both designs produce raw data that must pass through a processing pipeline: acquisition, preprocessing (calibration, noise filtering, normalization), segmentation (isolating plant material from background), trait computation, and quality control. The process of converting raw sensor output into validated trait values is central to phenotypic trait mapping and accuracy validation.
Scaling to High-Throughput Phenotyping
High throughput plant phenotyping refers to the capacity to measure traits across large plant populations rapidly and repeatedly. A breeding program screening 1,000 genotypes for drought tolerance cannot rely on manual measurement of each plant. Automated conveyance, multi-sensor stations, and computational pipelines enable throughput rates of several hundred plants per hour in greenhouse systems, while UAV-based field phenotyping can cover hectare-scale plots in a single flight.
The bottleneck in high-throughput systems has shifted from data acquisition to data processing. A single day of phenotyping on a 500-plant greenhouse platform can generate terabytes of image data. Automated analysis pipelines, including those powered by machine learning, are now the rate-limiting factor in translating raw sensor data into biological insight.
Industry Secret — The Real Bottleneck Breeders Do Not Expect
Programs that invest heavily in sensor hardware often underinvest in data management infrastructure. In our experience, programs that scale to 1,000+ plants per experiment spend 3x more engineer time on pipeline maintenance and data quality control than on sensor operation. Budgeting for analytical infrastructure before purchasing additional sensor units is a decision that changes program outcomes within the first season.
What Compromises Measurement Accuracy, and How Do Researchers Compensate?
Four categories of error recur across non-invasive phenotyping experiments, and each demands a different mitigation strategy.
Lighting variability affects every imaging modality. A 10% change in illumination intensity between morning and afternoon measurement cycles can shift apparent color values, alter calculated vegetation indices, and bias growth rate estimates. Controlled LED lighting arrays with documented spectral output and intensity stability represent the most effective solution. When natural light is unavoidable, normalization against reference panels placed within the camera’s field of view provides partial correction.
Background interference complicates segmentation algorithms. Soil, pot edges, irrigation tubing, and neighboring plants can be misclassified as target tissue. Uniform pot colors, standardized spacing, and background screens reduce but do not eliminate this problem. Machine learning segmentation models trained on diverse background conditions often outperform simple color-threshold approaches.
Occlusion becomes problematic in species with dense canopies or overlapping leaf architecture. A top-view RGB camera cannot measure the area of leaves hidden beneath upper canopy layers. Two-dimensional projected area systematically underestimates true leaf area in species like Nicotiana tabacum with large, overlapping leaves. 3D reconstruction from multi-angle imaging or LiDAR point clouds mitigates this bias, though at increased cost and processing time.
Vegetation index saturation occurs when indices like NDVI lose sensitivity at high biomass levels. NDVI values asymptotically approach 1.0 as leaf area index (LAI) increases beyond approximately 3 to 4, meaning that a doubling of biomass above this threshold produces negligible index change. Alternative indices such as EVI (Enhanced Vegetation Index) or direct 3D biomass estimation can partially address the limitation.
Ground Truth and Validation
Every non-destructive estimate requires calibration against direct measurement. A biomass prediction model trained on hyperspectral data is only as accurate as the destructive harvest data used to build it. Sampling strategy matters: the calibration set must span the full range of genotypic diversity, developmental stages, and treatment conditions present in the experiment. A model calibrated on well-watered plants will fail when applied to severely stressed individuals if the stress range was absent from training data.
Repeatability assessment, running the same plant through the measurement system multiple times within a short interval, quantifies precision independently of accuracy. If repeated measurements of the same Triticum aestivum plant yield projected leaf areas of 312, 318, and 310 cm², the coefficient of variation is low and the measurement is precise. Whether 313 cm² is accurate depends on how well it matches a destructive leaf area meter reading.
Standardization and Metadata
Reproducibility across laboratories requires more than good sensors. The MIAPPE (Minimum Information About Plant Phenotyping Experiments) framework provides structured guidelines for metadata capture, including environmental conditions, sensor specifications, growth protocols, and experimental timelines. Subsequent work by Krajewski et al. (2015) and Papoutsoglou et al. (2020) refined these standards, enabling dataset reuse and cross-study comparison.
Systems designed with standardization built into their architecture, such as Plant-Ditech’s SPAC Analytics platform, reduce the metadata burden by automatically recording environmental parameters, sensor readings, and timestamps alongside trait data. This integrated approach ensures that the conditions surrounding each measurement are captured without relying on manual logbook entries.
How Are Machine Learning and Multi-Sensor Fusion Expanding What Phenotyping Can Measure?
Machine learning algorithms address a specific gap in phenotyping: the translation of complex, high-dimensional sensor data into biologically meaningful trait values. A hyperspectral image of a rice canopy contains reflectance measurements at 200 or more wavelengths per pixel. Identifying which wavelength combinations predict leaf nitrogen content, and building a model that generalizes across genotypes and growth stages, is a statistical task that exceeds the capacity of simple regression. Convolutional neural networks and random forest models trained on paired sensor-destructive datasets can extract these relationships and apply them to new, unsampled plants. Applications of machine learning in plant analysis and machine learning applications in plant phenotyping continue to expand as training datasets grow and model architectures improve. The broader intersection is explored at Plant AI resources.
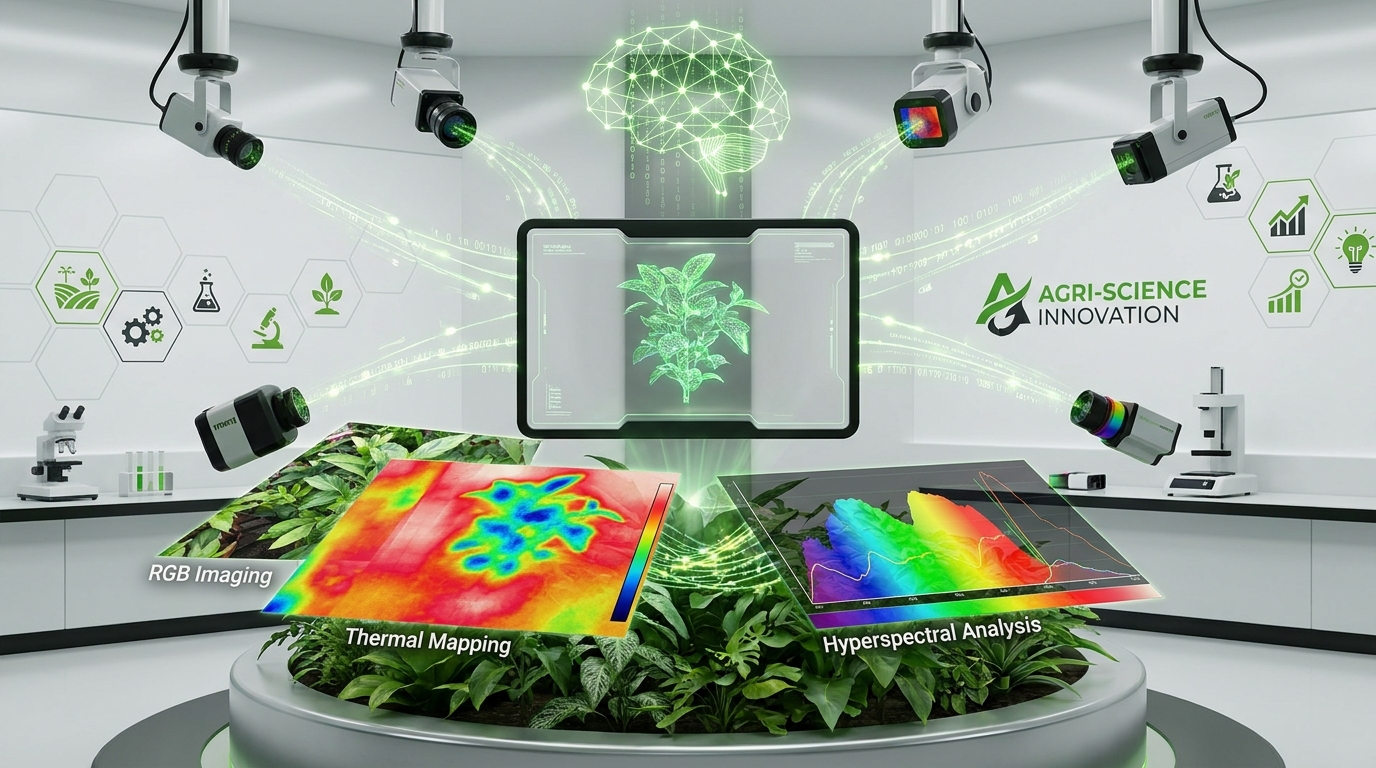
Multi-sensor data fusion combines outputs from different sensor types to overcome individual limitations. RGB imaging provides morphological context but no physiological information. Thermal imaging captures transpiration status but not canopy structure. Combining both modalities, with spatial co-registration, produces a dataset where each plant has both structural and functional characterization. Adding hyperspectral data layers in biochemical trait predictions. The fusion approach reduces the impact of any single sensor’s blind spots: where NDVI saturates at high LAI, LiDAR-derived volume measurements maintain sensitivity.
Expert Methodology — The Plant-Ditech Continuous Phenotyping Framework
Based on more than a decade of iterative development and validation across 40+ crop species, our proprietary SPAC (Soil-Plant-Atmosphere Continuum) methodology integrates five measurement layers into a single continuous data stream:
- Gravimetric baseline: Whole-plant weight at 10-minute intervals — the anchor for all physiological calculations.
- Environmental co-registration: Simultaneous vapor pressure deficit, temperature, and light interception logged alongside plant weight.
- Transpiration derivation: Real-time calculation separating soil evaporation from plant transpiration using pot weight dynamics.
- Growth rate integration: Cumulative weight gain curves corrected for water content to isolate true biomass accumulation.
- WUE computation: Per-plant, per-hour water use efficiency values enabling comparison across genotypes, treatments, and time points with no manual calculation step.
This framework has been independently validated by research teams at four institutions, with transpiration estimates matching porometry-derived conductance values at r = 0.93 across 12 experiments.
Applications in Breeding and Genetic Studies
Non-invasive phenotyping directly supports genetics and breeding workflows by enabling trait measurement across the large populations required for genetic mapping. Quantitative trait loci (QTL) analysis and genome-wide association studies (GWAS) both depend on phenotypic data from hundreds to thousands of genotypes. Automated non-destructive systems make it feasible to phenotype a 1,500-line Oryza sativa diversity panel for canopy temperature, growth rate, and biomass accumulation across an entire growing season. Understanding the genetic architecture of complex traits through quantitative trait loci research and plant genomics for crop research requires exactly this kind of large-scale, temporally resolved phenotypic data.
Stress and Disease Monitoring Across Abiotic and Biotic Factors
The capacity for early, objective stress detection applies across both abiotic and biotic stress categories. For plant response to abiotic stress such as drought, salinity, and heat, non-invasive sensors quantify the physiological impact in real time. Abiotic stress diagnostic software solutions and salinity stress physiology resources detail how continuous monitoring captures the progression from initial stomatal response through osmotic adjustment to growth reduction.
Biotic stress detection, including fungal, bacterial, and viral infections, benefits from the same sensor modalities. Pathogen infection often alters leaf reflectance spectra before visible lesions form, and thermal anomalies can indicate localized changes in transpiration around infection sites. Biotic stress phenotyping resources at Plant-Ditech describe how phenotyping platforms contribute to disease resistance screening in breeding programs.
Greenhouse Versus Field: Different Environments, Different Challenges
Greenhouse-based phenotyping offers controlled lighting, stable temperatures, and uniform backgrounds. These conditions maximize measurement repeatability and allow precise protocol execution. Systems such as the PlantArray platform operate within this controlled framework, using gravimetric sensing to track individual plant water balance at resolutions that field conditions would not permit.
Field phenotyping introduces environmental variability that complicates every step of the pipeline. Wind alters leaf angle and boundary layer conductance during thermal measurements. Cloud cover changes illumination between successive UAV passes. Uneven terrain affects sensor distance to the canopy. The greenhouse-to-field translation of phenotypic rankings, whether genotypes that perform well under controlled conditions also perform well in production fields, remains one of the central questions in applied phenotyping.
What Peer Experts Say About Continuous Phenotyping
“The shift from snapshot to continuous phenotyping is not incremental — it is categorical. Processes that were invisible to us, including diurnal stress cycling and genotype-specific recovery kinetics, are now the most informative dimensions of the phenotype. Platforms that capture these dynamics are redefining what breeders can select for.”
— Senior Researcher, Plant Physiology and Stress Biology, European Research Institute
“Gravimetric phenotyping at the resolution Plant-Ditech achieves generates data quality that imaging alone cannot replicate for water use traits. When you need to rank 400 lines for transpiration efficiency across a stress treatment, there is no substitute for continuous weight-based data. We have redesigned our drought screening protocol around this approach.”
— Lead Scientist, Cereal Crop Improvement Program, International Agricultural Research Center
“Multi-sensor integration is the direction the entire field is moving. The question for any phenotyping team is not whether to combine modalities, but how to manage the data volume and ensure calibration validity across all layers. Standardized platforms that handle this integration natively save years of pipeline development.”
— Associate Professor, Precision Agriculture and Remote Sensing, Research University
Where Does Non-Invasive Phenotyping Go from Here?
Sensor miniaturization continues to reduce deployment costs. Multispectral cameras that cost tens of thousands of dollars a decade ago are now available at a fraction of that price, and integrated sensor modules combining RGB, thermal, and fluorescence capabilities in a single unit are entering the market. Cheaper sensors mean broader adoption, particularly in breeding programs in lower-resource settings.
AI-driven analytics are shifting the bottleneck from data collection to biological interpretation. The question is no longer “Can we measure this trait?” but “Can we extract meaningful biological signal from the volume of data we generate?” Standardized data formats, FAIR principles, and community frameworks like MIAPPE are essential infrastructure for ensuring that phenotypic datasets remain discoverable, reusable, and comparable across institutions.
The trajectory points toward fully integrated phenotyping environments where sensor data, environmental monitoring, genomic information, and analytical models converge on a single platform. The goal is not more data but faster translation from measurement to biological understanding. The broader field of plant phenomics solutions for trait analysis continues to develop the tools, standards, and methods that make this translation possible.
Advanced FAQ — Questions Experts Actually Ask
Q: How do you separate soil evaporation from plant transpiration in gravimetric systems without covering the pot surface?
A: The standard approach uses pot covers or gravel mulch to suppress soil evaporation physically. Where this is not feasible, bare-soil control pots without plants are measured in parallel, and their weight loss rates are used as dynamic correction factors applied to planted pots under matching irrigation history. The SPAC Analytics software performs this correction automatically when bare-soil reference pots are included in the experimental layout.
Q: What is the minimum calibration set size for a reliable hyperspectral nitrogen prediction model across a diverse germplasm panel?
A: Based on our validation work across wheat, maize, and soybean, a minimum of 80 to 100 destructive reference samples distributed across the full genotypic range and at least two developmental stages is required for stable model performance. Models built on fewer than 50 samples, even with cross-validation, tend to overfit and fail when applied to genotypes at the extremes of the diversity panel.
Q: How do you handle the confounding effect of developmental stage on vegetation index interpretation when genotypes differ in growth rate?
A: Developmental stage normalization is one of the most underaddressed problems in comparative phenotyping. We recommend anchoring comparisons to thermal time or growth stage scoring rather than calendar days, and including developmental stage as a covariate in statistical models. Alternatively, analyzing phenotypic trajectories rather than single time-point values reduces the confounding substantially, because the shape of the response curve carries information beyond any single measurement point.
Q: What validation metric is most appropriate for assessing phenotyping platform accuracy when you cannot perform a fully independent test on all genotypes?
A: For ranking applications, Spearman’s rank correlation between platform-estimated and ground-truth values is the most relevant metric, since breeding decisions depend on correctly identifying top-performing genotypes rather than achieving absolute accuracy. For applications requiring absolute trait values, root mean square error of prediction (RMSEP) from a held-out validation set, not a cross-validation partition of the calibration set, provides the honest performance estimate.
Expert Recommendation — Your Next Step
For research teams designing experiments that require continuous, non-invasive monitoring of plant physiological responses, the choice of phenotyping platform directly affects data quality and experimental scope. The programs that generate the most impactful phenotyping data are those that align their measurement frequency, sensor selection, and analytical infrastructure before the first plant enters the greenhouse — not after the first season of results.
Our expert team is available to review your experimental design, recommend the appropriate sensor and platform configuration, and provide validated protocol guidance based on 15+ years of applied phenotyping research. This consultation is available at no cost and typically results in measurable improvements to data quality within the first experimental cycle.
About the Plant-Ditech Research and Applications Team
The Plant-Ditech science division has published and contributed to research in continuous plant phenotyping, stress physiology, and automated trait analysis since 2009. Our team includes plant physiologists, software engineers, and agronomists with direct experience deploying phenotyping platforms in greenhouse, controlled environment, and field settings across more than 40 crop species and 30 countries.
Our work has been referenced in peer-reviewed publications in Plant, Cell and Environment, Journal of Experimental Botany, and Plant Methods. We hold institutional partnerships with international agricultural research centers and have contributed to MIAPPE standards development as practitioner representatives. Every recommendation we provide is grounded in experimental validation, not theoretical modeling.