
In modern plant research, understanding quantitative trait loci (QTL) has become essential for improving crops in a targeted, data-driven way. QTLs provide a genetic roadmap to traits like yield, drought resistance, and growth efficiency. Below, we address the most common questions about QTL.
What are quantitative trait loci (QTL) and how do they influence plant traits?
QTLs are specific regions in a plant’s genome that are linked to quantitative traits, those that show continuous variation like plant height, transpiration, or biomass. Rather than being controlled by a single gene, these traits result from the interaction of multiple genes and environmental factors. Identifying QTLs helps researchers understand which genomic segments contribute to important agronomic traits.
How can I identify QTL in my plant research project?
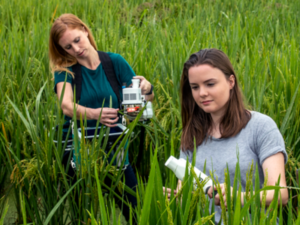
QTL identification involves collecting genetic data (such as DNA markers) and phenotypic data (measurable plant traits). Tools like PlantArray can help by accurately and continuously measuring the physiological response of plants, which is a useful tool for identifying variation in traits and linking them to genetic markers in population mapping.
What methods are most effective for mapping QTL in plants?
Common QTL mapping methods include:
- Linkage mapping using biparental populations (e.g., F2, RILs)
- Genome-wide association studies (GWAS) for broader genetic diversity
- Fine mapping to narrow down QTL regions
All of these require high-quality phenotypic data, an area where PlantArray excels, capturing time-series physiological data such as water-use efficiency (WUE), biomass, and transpiration under stress conditions.
How does QTL mapping contribute to plant breeding programs?
QTL mapping allows breeders to:
- Select parent lines based on genetic potential
- Develop marker-assisted selection (MAS) strategies
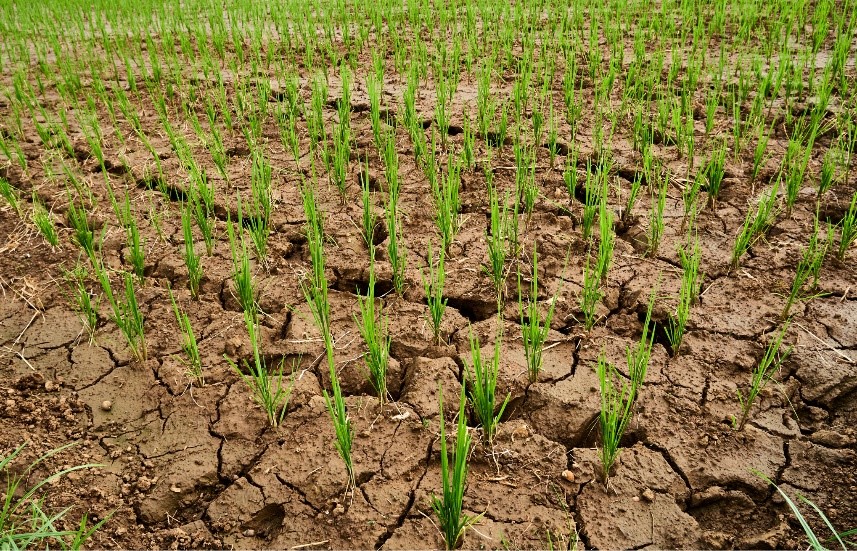
- Identify superior traits like drought tolerance or nutrient efficiency
When coupled with phenotyping platforms like PlantArray, breeders can validate QTLs under realistic growing conditions, speeding up the development of resilient, high-yield crops.

What are the challenges associated with QTL analysis in plant phenotyping?
- Environmental variability affecting phenotypic accuracy
- Complexity of quantitative traits (polygenic, interacting loci)
- Low reproducibility in traditional phenotyping setups
- PlantArray helps overcome these by delivering controlled and repeatable environmental conditions, ensuring consistent and high-resolution phenotypic data.
How can bioinformatics tools assist in the study of QTL?
Bioinformatics enables:
- QTL mapping using statistical models (e.g., interval mapping, mixed linear models)
- Integration of genotypic and phenotypic datasets
- Visualization of marker-trait associations
By feeding accurate, high-resolution phenotypic data from platforms like PlantArray into bioinformatics pipelines, researchers can significantly enhance the precision of QTL detection and modelling. The PlantArray system captures time-series physiological data such as transpiration rate, water-use efficiency, and biomass under controlled conditions, allowing for dynamic trait tracking rather than static snapshots. This continuous data stream improves statistical power in QTL mapping and supports multi-environment analysis, helping to uncover both stable and environment-specific QTLs.
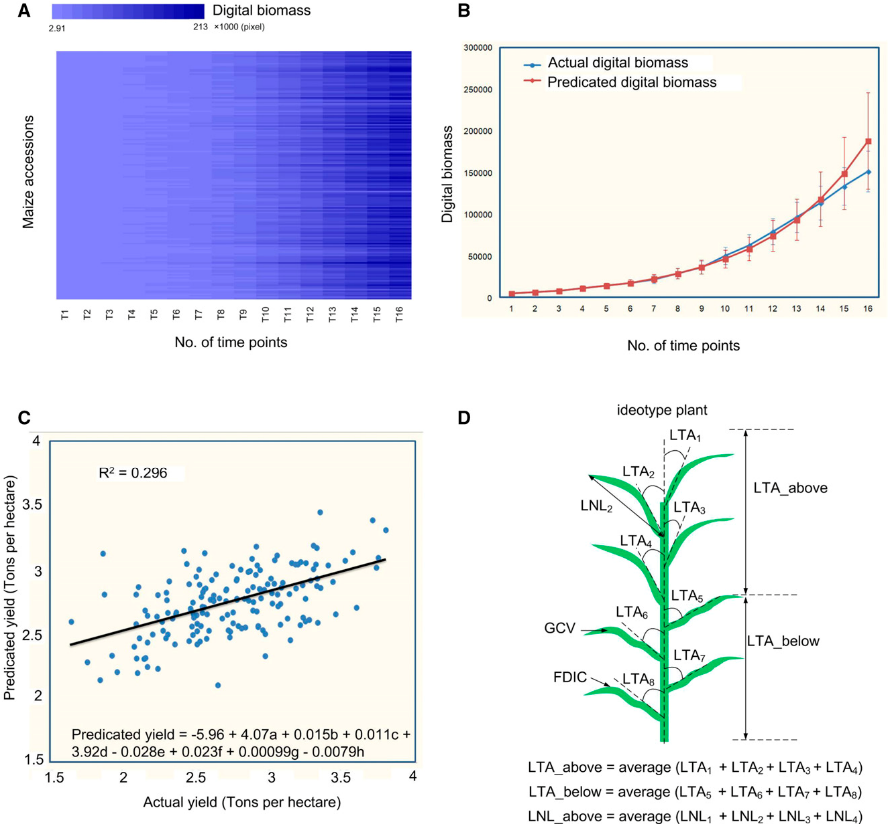
Dynamic biomass measurements and QTL prediction across time points:
- Panel A shows a heatmap of digital biomass data collected over multiple time points.
- Panel B plots actual vs. predicted biomass during development.
- Panel C reveals that predicted yield (based on early biomass data) correlates well with actual yield (R² ≈ 0.3)
Muraya, M. M., Chu, J., Zhao, Y., Junker, A., Klukas, C., Reif, J. C., & Altmann, T. (2017). Genomic prediction of maize hybrid performance using phenotypic data from high-throughput imaging platforms. Plant Physiology, 173(3), 1554–1566.
What role do genetic markers play in QTL mapping?
Genetic markers (e.g., SSRs, SNPs) act as landmarks in the genome, helping researchers locate QTLs by identifying co-segregation patterns between markers and phenotypic traits.
Can QTL analysis help in improving crop resilience and yield?
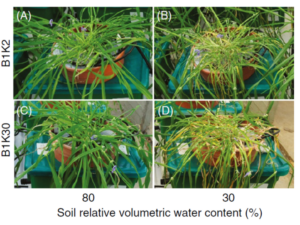
Yes. By identifying QTLs linked to drought tolerance, nutrient uptake, and biomass accumulation, researchers can breed crops that perform better under stress. With PlantArray, it’s possible to simulate real-world stress conditions while collecting continuous data, making it easier to pinpoint and validate these beneficial QTLs.
What are some examples of successful QTL applications in agriculture?
- Wheat: QTLs linked to drought resistance and early vigor
- Rice: QTLs improving nitrogen-use efficiency
- Maize: QTLs enhancing root structure and water uptake
- Tomato: QTLs tied to fruit quality and stress response
How do environmental factors interact with QTL to affect plant development?
Environmental conditions can amplify or suppress the expression of certain QTLs. This gene-environment interaction is a major reason why functional phenotyping is critical.
Combining QTL analysis with automated digital phenotyping platforms like Plant-Ditech’s PlantArray brings a new level of precision to plant research. It accelerates the breeding process, improves understanding of trait evolution, and enables the selection of resistant, high-yielding crops.
Whether you are a breeder, academic researcher, or agrotech innovator, mastering QTL with the right tools is key to the future of sustainable agriculture.