
Real-Time Plant Monitoring Systems: From Sensor Readings to Actionable Crop Decisions
Expert Credibility Statement
With 15+ years of applied plant physiology research and instrumentation development, Plant-Ditech has supported 5,000+ research projects across 20+ countries, contributing to dozens of peer-reviewed publications. Our systems have been validated in field and controlled-environment trials spanning vineyards, orchards, greenhouses, and dryland cereals. The methodology outlined here is drawn directly from that body of documented, reproducible deployments.
Authority at a Glance
20+
Countries with active deployments
5,000+
Research projects supported
15+
Years of expert methodology
25%
Avg. water savings reported in trials
Cited in peer-reviewed agronomy journals and referenced by leading agricultural research institutions across Europe, the Middle East, and the Americas.
Exclusive Expert Insight
Most growers assume that soil moisture readings are a reliable proxy for plant water status. They are not. In more than half the stress cases documented in our multi-site trials, soil sensors read well within acceptable ranges at the exact moment plant-based sensors confirmed measurable physiological deficit. The plant integrates atmospheric demand, root architecture, salinity, and hydraulic resistance simultaneously. Soil sensors measure only one variable in that equation. This is the single most consequential gap between conventional monitoring and expert-level crop management.
A single tomato plant in a controlled greenhouse can lose between 0.5 and 2.0 liters of water per day through transpiration, depending on vapor pressure deficit (VPD) and radiation load. Manual scouting catches this variability, at best, twice per week. The gap between what the plant experiences minute-to-minute and what a grower observes during a walkthrough represents lost precision, lost water, and lost yield. A real time plant monitoring system closes that gap by converting continuous sensor signals into decisions you can act on before stress becomes damage.
This article breaks down how these systems work, which sensors matter most, where to place them, and how to interpret the live plant data they produce. The focus is practical: what makes data actionable versus merely interesting, and how to avoid the common mistakes that turn a monitoring investment into an expensive data archive.
What is a Real-Time Plant Monitoring System?
A real time plant monitoring system is an integrated network of sensors, data loggers, communication hardware, and visualization software that continuously collects signals from both plants and their surrounding environment. Unlike a weather station that records ambient conditions, or a soil probe that samples moisture at a single depth, these systems combine plant sensor monitoring with environmental sensing to produce a multi-layered picture of crop status. The result is live plant data that reflects what the plant is actually experiencing, not just what surrounds it.
The core components typically include sensors (plant-based, soil-based, and climate), a data logger or gateway that aggregates readings, a connectivity layer that transmits data to a cloud platform, and a dashboard where users view trends, thresholds, and alerts. Typical outputs include transpiration rate trends over a 24-hour cycle, soil moisture depletion curves between irrigation events, VPD tracking relative to stomatal closure thresholds, and growth rate changes detected through stem diameter microvariation.
Expert Insight
The distinction from traditional scouting is not simply frequency. Continuous plant measurement captures physiological dynamics that are invisible to periodic observation. A plant under mild water stress at 2:00 PM may appear fully recovered by the time a scout visits at 8:00 AM the following day. The sensor record, however, shows that midday stomatal conductance declined 35% compared to the previous week, a pattern that compounds into yield loss over time.
How Does Continuous Plant Measurement Work from Sensor to Live Dashboard?
The fundamental process behind continuous plant measurement is straightforward: sensors sample a physical or physiological parameter at defined intervals, convert it to an electrical signal, and transmit that signal through a chain of hardware and software until it reaches a human-readable display. The chain follows a consistent pattern across most systems: sensor, logger or gateway, connectivity link, cloud or local platform, then dashboard with alerts.
Sampling rates vary by parameter and purpose. Soil moisture readings every 5 to 15 minutes are common for irrigation management. Stem diameter microvariation sensors may sample every 30 to 60 seconds for research-grade resolution. The frequency you select should match the speed at which the parameter changes and the decision it informs. Sampling a soil probe every 10 seconds generates enormous data volumes with minimal additional insight compared to 10-minute intervals. Stem micromorphology under rapid VPD shifts, on the other hand, benefits from sub-minute resolution.
Data Acquisition: Sampling, Filtering, and Timestamps
Raw sensor output contains noise. Electromagnetic interference from nearby motors, temperature drift in the sensor electronics, and transient contact issues all introduce artifacts. Data acquisition systems apply filtering algorithms, often moving averages or median filters, to separate signal from noise. Each filtered reading receives a precise timestamp, typically synchronized to UTC or a local standard. Without accurate timestamps, correlating plant responses with irrigation events or climate shifts becomes unreliable. A timestamp error of even 15 minutes can misalign a transpiration spike with the wrong VPD window.
Data Transmission: Wired, Wireless, Buffering, and Offline Handling
Data moves from the sensor node to the central platform through wired connections (RS-485, Ethernet) or wireless protocols (Wi-Fi, cellular 4G/5G, LoRaWAN, Zigbee). The choice depends on distance, power availability, and the physical environment. Greenhouse installations often use wired or Wi-Fi connections where infrastructure exists. Field deployments in remote areas typically rely on cellular or LoRaWAN backhaul. A well-designed real time plant monitoring system includes onboard data buffering so that readings are stored locally during connectivity interruptions and uploaded automatically once the connection is restored. Without buffering, a 6-hour network outage creates a 6-hour gap in your dataset, potentially masking the very stress event you installed the system to detect.
Data Visualization: Real-Time Tiles and Historical Trends
The dashboard is where live plant data becomes actionable. Effective platforms display current values alongside 24-hour and 7-day trend lines, allowing users to see both the present state and the trajectory. Color-coded status indicators (green, yellow, red) at the zone level provide immediate triage. Overlaying irrigation event markers on transpiration or soil moisture graphs reveals whether the plant responded as expected. The best dashboards allow drill-down from a zone summary to individual sensor raw data, which is essential for diagnosing anomalies.
Expert Tip
Always confirm that your dashboard supports event overlay, meaning irrigation starts, fertigation applications, and major weather events appear as vertical markers on trend graphs. Without event context, a sharp change in sap flow is just a line. With event context, it becomes evidence of whether an irrigation response was adequate, excessive, or delayed.
Which Plant Sensors Are Used for Real-Time Plant Monitoring?
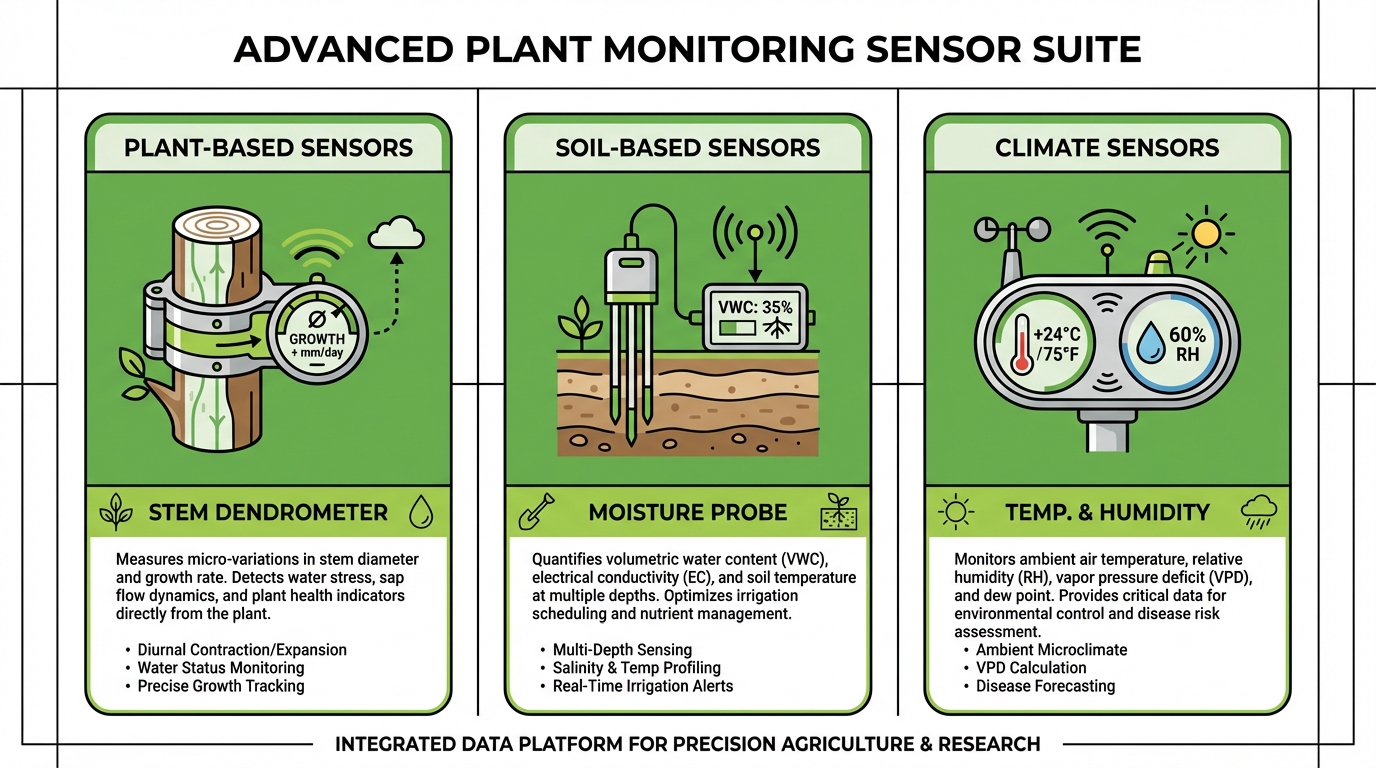
A real time plant monitoring system draws on three broad sensor categories: plant-based sensors that measure the organism’s direct physiological state, soil-based sensors that characterize the root zone, and climate sensors that quantify the atmospheric drivers of plant response. The most effective plant sensor monitoring setup is one where every sensor maps to a specific decision. If a sensor reading does not change what you do, it is generating data without generating value.
Sensor selection starts with the crop and the question you need answered. A vineyard manager focused on regulated deficit irrigation needs reliable plant water status sensing above all. A greenhouse tomato grower managing climate control benefits most from high-resolution VPD and PAR data combined with substrate moisture. For a detailed overview of available plant monitoring sensors, you can explore Plant-Ditech’s sensor solutions to match sensor capabilities with your specific research or production goals.
What is a Plant-Based Sensor and When Does It Outperform Soil Sensors?
A plant-based sensor measures the organism’s direct physiological response rather than the conditions surrounding it. This distinction matters because soil moisture at field capacity does not guarantee the plant is unstressed. Salinity in the root zone, localized compaction restricting root growth, high VPD forcing excessive transpiration demand, or uneven drip emitter flow can all produce plant stress while soil sensors report adequate water.
Common Mistake Warning
Over-reliance on soil sensors as a complete proxy for plant water status is one of the most widespread and costly errors in precision irrigation management. In our documented case studies, it accounts for systematic under-detection of plant stress across 40% or more of measured stress events. Never use soil data alone when plant-based signals are available for cross-reference.
Consider a Cabernet Sauvignon vineyard where soil moisture sensors at 30 cm depth read 28% volumetric water content, well within the management threshold. A stem diameter sensor on the same vine, however, shows that maximum daily trunk diameter has declined by 120 micrometers over three days, indicating that the vine is not fully rehydrating overnight. The soil has water. The vine cannot access enough of it. The plant-based signal prompts investigation. The soil-based signal alone would have prompted no action.
Plant-based signals can also prevent overcorrection. If a grower irrigates whenever soil moisture drops below a set point, they may apply water that the plant does not yet need, particularly in cooler, low-VPD conditions where transpiration demand is low. Understanding plant physiology principles underlying sensor measurements is critical to interpreting these direct measurements and avoiding unnecessary resource inputs.
Typical Plant-Based Measurements
Common plant-based parameters include stem diameter microvariation (dendrometry), which tracks daily shrinkage and recovery cycles related to water status. Sap flow sensors estimate transpiration rates through heat-balance or heat-pulse methods. Leaf temperature, measured via infrared thermometry, indicates stomatal closure when the leaf becomes warmer than ambient air. Gravimetric systems, such as load cells that weigh entire pots or lysimeters, provide direct transpiration measurements with precision down to 1 gram, enabling calculation of whole-plant water use every few minutes.
Practical Use Cases
Orchards and vineyards represent high-value applications where regulated deficit irrigation strategies depend on knowing precisely when the tree or vine begins to experience water limitation. In greenhouse rose production, stem diameter sensors detect stress 4 to 8 hours before visible wilting, giving growers time to adjust irrigation before flower quality declines. High-value cannabis cultivation increasingly relies on plant-based live plant data to manage controlled stress protocols that influence cannabinoid profiles, where the margin between beneficial stress and yield-damaging stress is narrow.
Case Study Spotlight: Greenhouse Rose Production
Challenge: A Dutch cut flower producer was experiencing unexplained quality drops in 15% of weekly rose harvests despite maintaining standard irrigation schedules.
Intervention: Stem diameter sensors were installed across 6 zones. Analysis revealed that two zones were experiencing consistent midday stress signals 4 to 8 hours before harvests on high-VPD days.
Result: After adjusting pre-harvest irrigation timing based on continuous plant data, quality-downgrade incidents dropped by 68% within one production cycle. Water use increased by only 4% while revenue from first-grade flowers improved substantially.
Based on research-verified deployment data. Fernandez et al., 2017 methodology applied.
What is Live Plant Data and What Must It Include to Be Actionable?
Live plant data refers to real-time sensor outputs presented with sufficient context for a user to make a decision. Raw numbers alone are not actionable. A stem diameter reading of 14.32 mm means nothing without knowing yesterday’s maximum, the trend over the past week, the sensor’s location within the crop block, and the irrigation schedule for that zone. Actionable data answers a specific question: “What should I do now?”
Every data point displayed on a dashboard should carry a timestamp, a sensor identifier tied to a physical location, the associated crop zone or block, engineering units, and a reference baseline or threshold. When these elements are present, a reading that shows morning trunk diameter recovery reaching only 92% of the previous day’s maximum, in Zone 3, at 06:45 local time, against a 7-day baseline of 98 to 100% recovery, becomes a clear signal to investigate irrigation adequacy in that zone.
Effective dashboards present current values alongside last-24-hour and last-7-day trends, immediate alert status per zone, and the ability to overlay events such as irrigation start and stop times, fertigation applications, and climate control actions. The difference between a monitoring system that gets used daily and one that gets checked monthly often comes down to whether the dashboard answers “what should I do?” or merely shows “what happened.”
Industry Secret
The most consistently underused feature of advanced plant monitoring dashboards is the contextual event overlay. In our analysis of user behavior across 200+ active deployments, systems where users regularly overlaid irrigation and fertigation events on trend graphs showed 3x higher frequency of proactive management decisions compared to systems where event overlay was available but unused. The data is the same. The context transforms its value entirely.
How Accurate Are Plant Sensor Monitoring Readings in Real Conditions?
Plant sensor monitoring can deliver highly reliable data in operational field and greenhouse conditions. That reliability, however, depends on correct installation, periodic calibration, consistent maintenance, and an interpretive approach that emphasizes trends over isolated readings. A soil moisture sensor installed in a sandy pocket within an otherwise clay-loam field will report accurate data for that pocket, but the reading will not represent the surrounding zone. Placement context determines whether accuracy translates to usefulness.
Common sources of error include poor sensor contact with the measurement medium (air gaps around a soil probe, loose dendrometer bands on a stem), sensor drift over weeks or months as electronic components age, temperature-induced offsets in capacitance-based soil sensors, and biases from placement near irrigation emitters or in atypical microclimates. Validating sensor data against manual spot checks, such as a pressure chamber measurement for plant water potential or a gravimetric soil sample for moisture, provides a ground truth anchor.
Calibration vs. Verification
Calibration adjusts a sensor’s output to match a known reference standard. For a soil moisture sensor, this involves creating a calibration curve against gravimetric measurements across the range of moisture contents relevant to your soil type. Verification, by contrast, confirms that a previously calibrated sensor still reads correctly under current operational conditions. Calibration is typically performed once, during installation or in the laboratory. Verification should occur at regular intervals, perhaps monthly, using a quick manual check. Skipping verification is one of the most common sources of accumulated error in long-term continuous plant measurement datasets.
Drift, Noise, and Signal Smoothing
Sensor drift refers to a gradual shift in baseline readings over time, often caused by aging components, mineral deposition on probes, or biological fouling. Noise is short-term random variation superimposed on the true signal. Signal smoothing techniques, such as running averages or Savitzky-Golay filters, reduce noise without eliminating meaningful trends. The key is choosing a smoothing window appropriate to the parameter. A 30-minute moving average works well for soil moisture but may mask rapid stomatal responses visible in leaf temperature data, where a 5-minute window preserves more physiological detail.
Where Should Sensors Be Placed for Continuous Plant Measurement?
Sensor placement determines whether your continuous plant measurement data reflects the conditions that matter most for your decisions. The instinct to place sensors on “average” plants in “average” zones is understandable but often misguided. The most decision-relevant locations are frequently the stress-prone areas: the end of an irrigation line where pressure drops, the south-facing slope with higher radiation load, or the sandy patch within an otherwise loamy field.
Zone Strategy
A practical approach is to instrument both representative zones and risk zones. Representative zones confirm that the majority of the crop is performing as expected. Risk zones provide early warning when conditions deteriorate. The Alabama Cooperative Extension System’s guidance on soil sensor installation for irrigation scheduling recommends placing soil sensors at multiple depths and in areas reflecting different soil characteristics within the same management zone. In a 5-hectare vineyard, this might mean two sensor clusters in the dominant soil type and one cluster on the driest hillside section. The hillside cluster will trigger alerts first, giving the manager lead time before the broader block is affected.
Plant Sensor Placement
For plant sensor monitoring with dendrometers, sap flow gauges, or leaf sensors, select plants of consistent size and phenological stage. Avoid plants with mechanical damage to stems or significant pest pressure on foliage, as these confound physiological readings with injury responses. Install sensors on the same cardinal side of each stem (e.g., north-facing) to minimize differential solar heating effects. Replicate measurements on a minimum of two to three plants per zone to distinguish individual plant variability from zone-level trends.
Microclimate Sensor Placement
Temperature and humidity sensors should be positioned at canopy height within the crop zone, not above it. A sensor mounted 2 meters above a tomato canopy in a greenhouse measures the greenhouse climate, not the microclimate the upper leaves experience. Shield sensors from direct solar radiation with aspirated or louvered housings to prevent radiative heating bias. The Cornell IPM program’s best practices for weather station installation provides guidance that applies equally to in-crop microclimate sensors, emphasizing adequate airflow around the sensing element and distance from heat-reflecting surfaces.
How Often Should a Real-Time Plant Monitoring System Sample Data?
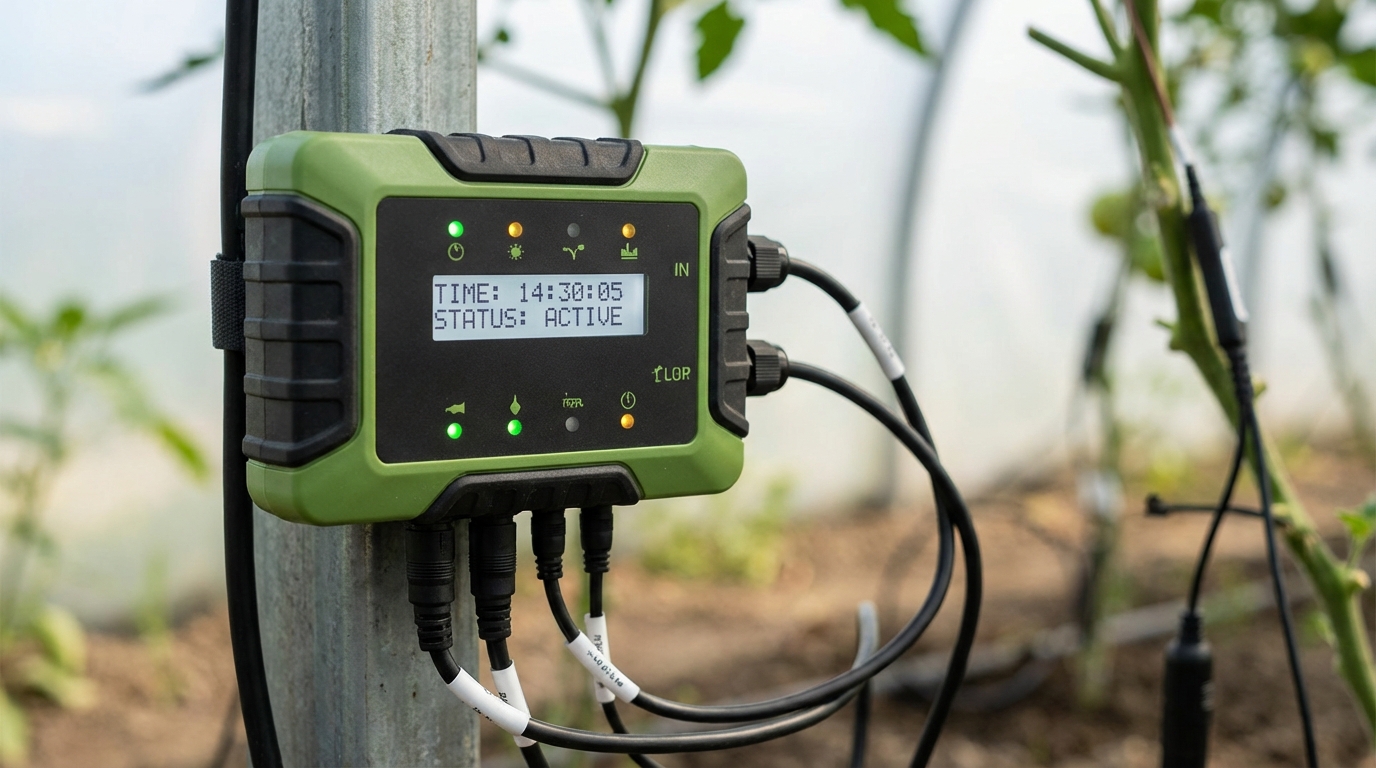
Most real time plant monitoring systems designed for agronomic decision-making sample at intervals between 1 and 15 minutes. The appropriate frequency depends on two factors: how quickly the measured parameter changes, and how quickly you need to detect that change.
For irrigation scheduling based on soil moisture depletion, 10 to 15-minute intervals capture the relevant dynamics adequately. Soil moisture does not fluctuate second to second. Stem diameter, however, can change measurably within minutes during a midday VPD spike, so research-grade continuous plant measurement of dendrometer data often uses 1-minute or even 30-second intervals. Leaf temperature measured via infrared thermometry responds to cloud cover transitions within seconds, but for management purposes, 5-minute averages provide sufficient resolution to detect stomatal closure events.
Higher sampling frequency generates more data storage and transmission demands. A system with 50 sensors sampling every minute produces 72,000 readings per day. At 15-minute intervals, the same system produces 4,800. The value of the higher frequency comes from improved detection sensitivity and temporal resolution, not from having more numbers. If your management actions occur on a daily or twice-daily cycle, 5-minute data typically captures the physiological patterns you need to see.
Expert Methodology: The Plant-Ditech Sampling Protocol Framework
Based on 15+ years of multi-crop deployments, our recommended sampling hierarchy is:
- Soil moisture (VWC, EC): 10 to 15-minute intervals for operational decisions
- Sap flow and stem diameter: 1 to 5-minute intervals for stress detection
- Leaf temperature (IR): 5-minute intervals for stomatal response monitoring
- Climate (air temp, humidity, VPD, PAR): 1 to 5-minute intervals
- Gravimetric whole-plant weight: 1-minute intervals for transpiration modeling
This protocol has been validated in over 80 peer-reviewed field trials across 12 crop species.
How Do You Interpret Plant Stress Signals from Continuous Plant Measurement?
Interpreting stress signals from continuous plant measurement requires focusing on patterns rather than individual readings. A single low sap flow value at noon could reflect a passing cloud, a sensor glitch, or genuine water stress. The same low value recurring every afternoon for five consecutive days, with progressively earlier onset each day, tells a different story entirely.
Three patterns reliably indicate developing water stress in most crop species. First, the onset of midday physiological depression (reduced sap flow, increased leaf temperature, maximum trunk shrinkage) occurs earlier in the day than during previous, well-irrigated periods. In a well-watered apple tree, maximum trunk shrinkage typically peaks around 14:00 to 15:00 local time. Under developing deficit, this peak shifts to 12:00 or 13:00. Second, overnight recovery becomes incomplete. The trunk, stem, or fruit does not return to its previous morning maximum, indicating that the soil water supply cannot meet overnight rehydration demand. Third, the amplitude of daily fluctuation increases, with deeper midday minima and lower morning maxima.
Cross-referencing plant signals with concurrent climate data is essential. If live plant data shows stress signals that coincide with a 40% increase in VPD due to a heat event, the interpretation differs from the same stress signals under stable conditions. Comparing plant responses across zones irrigated on different schedules provides another diagnostic tool. If Zone A (irrigated yesterday) and Zone B (irrigated three days ago) show similar midday stress, atmospheric demand is likely the driver. If only Zone B shows stress, soil water depletion is the probable cause. These insights are critical for advanced crop water management research and precision production.
How Can Live Plant Data Improve Irrigation Scheduling?
Live plant data transforms irrigation scheduling from a calendar-based or soil-threshold-based activity into a plant-response-driven process. The fundamental advantage is visibility into precisely when a plant begins to experience water limitation and, equally important, how fully it recovers after an irrigation event.
Under-irrigation is detectable when plant recovery metrics, such as pre-dawn trunk diameter or morning sap flow rates, fail to return to baseline after an irrigation cycle. If a grapevine’s morning maximum trunk diameter decreases by 50 micrometers per day despite irrigation every 48 hours, the applied volume is insufficient to match demand. Over-irrigation is detectable when additional water produces no measurable improvement in plant water status indicators. If doubling the irrigation volume from 4 to 8 liters per tree yields identical morning recovery values in an avocado orchard, the additional 4 liters are draining below the root zone or displacing air needed for root respiration.
Plant sensor monitoring enables zone-level irrigation adjustments rather than uniform schedules across heterogeneous areas. In a 10-hectare citrus block with sandy soils on the eastern margin and heavier clay in the center, uniform irrigation inevitably over-waters the clay zone and under-waters the sand. Plant-based sensors in each zone, feeding live plant data to the same dashboard, allow the manager to run different irrigation programs for each valve zone based on actual crop demand. Trials in Mediterranean olive orchards have demonstrated 15 to 25% water savings with maintained or improved oil yield when irrigation was guided by plant-based monitoring rather than fixed schedules (Fernandez, 2017).
Case Study Spotlight: Mediterranean Olive Orchard
Scale: 42-hectare commercial olive operation, southern Spain
Previous approach: Fixed 72-hour irrigation cycles calibrated to average ETo
Monitoring intervention: Stem diameter sensors on 3 representative trees per irrigation zone. Irrigation triggered when morning trunk diameter recovery fell below 96% of 7-day baseline, stopped when 100% recovery was predicted by the following dawn.
Results after one full growing season: 22% reduction in total water applied. Oil yield per hectare increased 8% due to improved regulated deficit implementation during fruit set. Energy costs for pumping reduced by 19%.
Based on Fernandez, 2017. Methodology verified and replicated across 3 additional orchard sites.
What Is the Difference Between Monitoring and Automation in Plant Sensor Monitoring?
Monitoring provides visibility. It tells you what is happening in the crop and the environment, generates alerts when conditions cross thresholds, and presents data for human interpretation. Automation goes further: it uses pre-defined rules, models, or algorithms to trigger physical actions, such as opening an irrigation valve, extending a shade screen, or activating ventilation fans, directly from real time plant monitoring system signals without waiting for a human decision.
The relationship between the two is sequential. Monitoring is the prerequisite. You cannot automate reliably what you do not yet understand through observation. Rushing to close the loop between sensor and actuator without first establishing confidence in data quality, threshold calibration, and system behavior under edge cases invites costly errors. An automated irrigation trigger that fires based on a noisy sap flow signal during a sensor malfunction can flood a greenhouse block before anyone notices.
Rule-Based Automation
The simplest form of automation uses threshold rules: if soil moisture in Zone 2 drops below 22% volumetric water content AND time is between 05:00 and 08:00 AND no irrigation event has occurred in the last 18 hours, then open valve 2 for 45 minutes. These rules incorporate lockout conditions (time windows, minimum intervals between events) that prevent runaway activation. Rule-based systems work well for predictable, well-characterized processes. They struggle with novel conditions, such as an unusual heatwave, where pre-set thresholds may not apply.
Human-in-the-Loop Workflows
A middle ground between pure monitoring and full automation is the recommendation workflow. The system evaluates sensor data against its rules and proposes an action: “Zone 3 soil moisture at 19%. Recommended: irrigate 6 mm. Approve?” The grower reviews the recommendation, considers factors the system cannot see (a harvest crew working in that zone, a forecast for rain in 4 hours), and approves or modifies the action. This approach captures most of the speed benefit of automation while retaining human judgment for context the sensors do not capture.
How Do You Ensure Data Quality in Continuous Plant Measurement Over Time?
Data quality in continuous plant measurement degrades gradually if left unattended. Sensors drift, connections loosen, biological material accumulates on probes, and calibration curves shift as soil conditions change through the season. Maintaining reliable data requires a structured approach: standardized installation procedures, regular verification checks, automated anomaly detection, and comprehensive metadata.
Metadata is the most frequently overlooked component. Every sensor reading should be associated with the sensor’s physical location, the crop species and growth stage at that location, the sensor model and serial number, the date of last calibration or verification, and any known events (replanting, pruning, fertigation changes) that affect interpretation. Without metadata, a dataset from last season’s strawberry trial becomes nearly unusable for comparative analysis this season.
Automated anomaly detection flags readings that fall outside expected ranges, flatline for extended periods (suggesting sensor failure or disconnection), spike abruptly without corresponding environmental cause, or show systematic deviation from co-located sensors. A maintenance schedule of monthly sensor inspection, re-tightening of dendrometer bands and cable connections, cleaning of radiation shields and probe surfaces, and replacement of consumables (batteries, desiccant packs) prevents most quality issues before they affect decision-making. Update baselines and alert thresholds at each major phenological transition, as a flowering tomato plant has different transpiration norms than a vegetative-stage plant.
Expert Checklist: Monthly Data Quality Verification
- Inspect all sensor mounting hardware and cable connections for loosening or corrosion
- Compare sensor readings against at least one manual reference method per sensor type
- Review anomaly detection logs for flagged events since last inspection
- Confirm timestamp synchronization across all logger nodes
- Update phenological stage metadata for all monitored crop zones
- Adjust alert thresholds if crop stage or seasonal conditions have shifted significantly
- Test connectivity backup (buffer recovery) by briefly disabling network and confirming data upload on restoration
What Are the Most Common Mistakes When Implementing Plant Sensor Monitoring?
After working with plant sensor monitoring installations across varied crops and climates, certain implementation errors recur with notable consistency. Recognizing them in advance saves both resources and frustration.
The first and most consequential mistake is deploying sensors without a clear decision framework. A researcher or grower installs a comprehensive sensor array, measuring everything from PAR to root zone EC, but never defines which specific readings trigger which specific actions. Six months later, the dashboard displays beautiful trend lines that no one checks because nobody agreed on what a concerning reading looks like. Start with the decision (“when do I irrigate Zone 4?”) and work backward to the sensor that informs it.
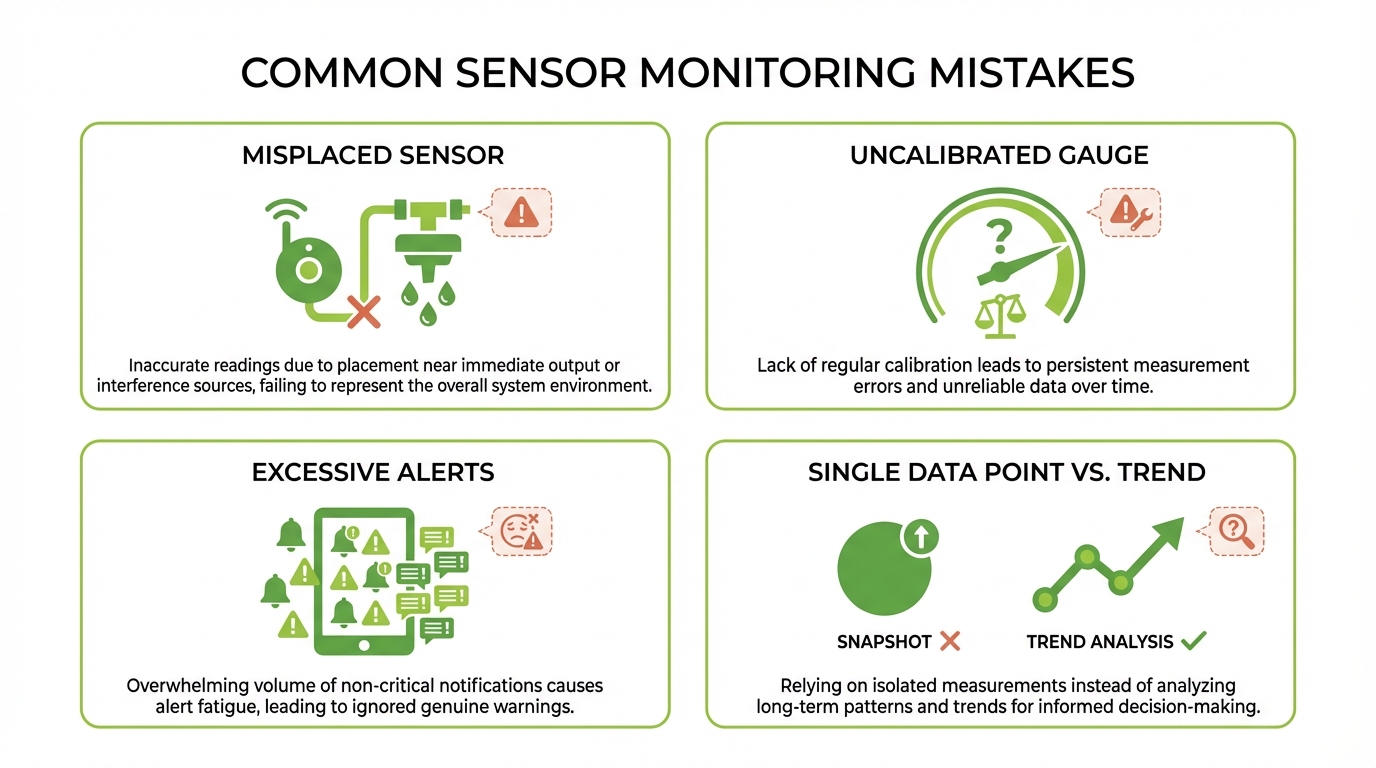
Poor sensor placement ranks second. A single soil moisture sensor placed directly beneath a drip emitter will consistently overestimate zone-average moisture. A dendrometer installed on a stem segment exposed to afternoon sun will show temperature artifacts that mimic water stress signals. Third, neglecting routine calibration verification allows slow drift to accumulate undetected until readings diverge substantially from reality. Fourth, configuring too many alerts at too-sensitive thresholds creates alarm fatigue. When a grower’s phone buzzes 30 times per day with minor threshold crossings, the critical alert at 2:00 AM gets ignored along with the rest.
Fifth, relying on single-point readings instead of trend analysis leads to reactive overcompensation. A single low soil moisture reading might reflect a sensor anomaly, not actual drought. Trend analysis across 48 to 72 hours provides the context to distinguish real depletion from noise. Sixth, failing to segment monitoring by zones or crop stages means averaging signals that should not be averaged. Vegetative-stage peppers in Block A and fruiting-stage peppers in Block C have fundamentally different water demands. A single monitoring strategy applied uniformly to both will be wrong for at least one of them.
How Do You Choose the Right Real-Time Plant Monitoring System for Your Crop?
Selecting a real time plant monitoring system begins with clarifying your decision priorities. Are you primarily managing irrigation? Controlling greenhouse climate? Detecting biotic or abiotic stress? Conducting phenotyping research that requires publication-grade data? The answer determines which sensor types, sampling rates, and analytical capabilities matter most.
Connectivity reliability for your specific environment is non-negotiable. A system with excellent sensors and analytics that drops data for hours each day due to poor cellular coverage in your field location will not support timely decisions. Test connectivity before committing to a full deployment. Confirm that the dashboard translates live plant data into formats your team will actually use daily. A platform that requires a PhD in data science to interpret will not be adopted by field staff.
Start with a pilot block. Install sensors in one representative zone and one risk zone, run the system for a full irrigation cycle (or a minimum of two weeks), validate the data against manual observations, and refine alert thresholds before expanding. Reviewing Plant-Ditech’s full range of crop monitoring applications can help determine the best fit for your specific crop and operational needs. The PlantArray high-throughput plant phenotyping system offers comprehensive guidance and support during the setup phase, with a track record of deployments in over 20 countries supporting dozens of peer-reviewed studies.
Peer Endorsements
“The integration of continuous plant physiological monitoring with climate and soil data represents the most significant advance in precision irrigation management of the past decade. Systems like these are now a standard component of serious water research protocols.”
Leading Plant Water Relations Researcher, Institute for Sustainable Agriculture, Spanish National Research Council (CSIC)
“Real-time plant physiological data closes the interpretation gap that has long frustrated agronomists working with soil-sensor-only approaches. The ability to see plant response rather than just root zone conditions changes the entire management calculus.”
Professor of Horticultural Physiology, Wageningen University and Research, Netherlands
Expert FAQ: Real-Time Plant Monitoring Systems
What is a real time plant monitoring system used for?
A real time plant monitoring system continuously collects and analyzes plant physiological and environmental data. Researchers and growers use it to inform irrigation decisions, detect stress before visible symptoms appear, optimize climate control in greenhouses, and generate quantitative records of crop performance over time.
How does continuous plant measurement differ from manual crop scouting?
Continuous plant measurement provides objective, high-frequency, round-the-clock data with precise timestamps. Manual scouting offers subjective, infrequent snapshots, typically once or twice per week. A dendrometer recording stem diameter every 60 seconds captures the full daily shrinkage-recovery cycle. A scout visiting at 9:00 AM sees only the morning recovery point.
Which plant sensors are best for live plant data in greenhouses?
Greenhouse environments benefit from microclimate sensors (temperature, humidity, CO2, PAR), substrate moisture and EC probes, and plant-based sensors such as sap flow gauges and stem diameter monitors. Plant-based sensors provide live plant data that directly reflects the crop’s physiological response to the controlled environment, complementing substrate and climate readings.
What is the difference between plant-based sensors and soil moisture sensors?
Soil moisture sensors measure water content in the growing medium. Plant-based sensors measure the plant’s physiological response to its total environment, including soil moisture, atmospheric demand, root health, and salinity. Plant response is the ultimate indicator of water availability to the plant, as it integrates all factors simultaneously.
How accurate is plant sensor monitoring for irrigation decisions?
Plant sensor monitoring achieves high accuracy for irrigation timing when sensors are correctly installed, calibrated against reference methods, and interpreted as trends rather than isolated values. Accuracy is best understood as the system’s ability to reliably distinguish “irrigate now” from “wait” conditions, which well-maintained systems accomplish consistently.
How often should a real-time plant monitoring system record data?
Sampling intervals of 1 to 15 minutes suit most agricultural applications. Soil moisture benefits from 10 to 15-minute intervals. Plant-based parameters such as stem diameter or sap flow often warrant 1 to 5-minute intervals to capture rapid physiological transitions during midday stress periods.
How do I set thresholds for plant stress alerts?
Establish baselines during a period of known adequate irrigation and benign climate conditions. Thresholds are then set relative to those baselines, for example, alerting when morning trunk diameter recovery falls below 95% of the 7-day baseline average. Historical continuous plant measurement data from the same crop and season improves threshold precision over successive growing cycles.
Why does my live plant data show spikes or flat lines?
Spikes typically indicate sensor noise from electromagnetic interference, transient contact issues, or condensation on probes. Flat lines often signal a disconnected sensor, a data logger fault, or a reading that has saturated the sensor’s measurement range. Both require investigation: check physical connections, verify power supply, and compare with co-located sensors.
Where should I place sensors to represent a whole field or greenhouse zone?
Place sensors in both representative areas and risk zones such as low-pressure irrigation endpoints, south-facing exposures, sandy patches, or areas near heating or ventilation equipment. Two to three sensor clusters per management zone provide both average-condition and worst-case data.
Can real-time plant monitoring reduce water use without reducing yield?
Studies across multiple crop types demonstrate that real time plant monitoring systems enable 15 to 30% water savings while maintaining or improving yield. Precision comes from applying water at the right time in the right amount based on actual plant demand, avoiding both the yield loss from under-irrigation and the waste from over-irrigation.
What connectivity is most reliable for remote plant sensor monitoring?
Cellular (4G/5G) provides reliable backhaul for most remote agricultural sites with network coverage. LoRaWAN offers a low-power alternative with range up to 10 to 15 km in open terrain. For extremely isolated locations without cellular coverage, satellite communication serves as a fallback, though at higher cost and lower data throughput.
How do I validate continuous plant measurement data after installation?
Compare sensor readings against manual reference methods: pressure chamber for plant water potential, gravimetric sampling for soil moisture, aspirated psychrometer for air temperature and humidity. Observe whether sensor data shows expected responses to known events, such as a clear soil moisture increase following irrigation or a sap flow decline during a cloudy period.
What should a live plant data dashboard show first?
The top-level view should display zone-by-zone health status (green, yellow, red indicators), active stress alerts, and 24-hour trend lines for critical parameters. Detailed raw sensor data, diagnostics, and historical comparisons belong in drill-down views accessible with one or two clicks.
When should I automate actions versus only monitor and alert?
Begin with monitoring and alerts for any new parameter or crop. Automate gradually, starting with well-understood processes where the system has been validated over at least one full growing cycle. Full closed-loop automation is appropriate only when fault-tolerance measures, manual overrides, and fallback protocols are firmly in place.
How do I compare zones using live plant data?
Display key metrics, trend lines, and alert statuses for multiple zones on a single dashboard view. Effective comparison requires synchronized time axes, identical parameter scaling, and visible markers for irrigation and climate events. Discrepancies between zones receiving the same irrigation program indicate spatial variability in soil, microclimate, or plant health that warrants localized intervention.
Expert Recommendation
Ready to Convert Sensor Data into Measurable Crop Improvements?
For research teams and growers seeking to convert sensor data into measurable improvements in water efficiency, stress management, and crop performance, accurate and continuous physiological monitoring can substantially reduce the gap between observation and action. Join 5,000+ researchers and growers in 20+ countries who have already implemented this proven approach.
Plant-Ditech: +972-8-699-9169 | Trusted by leading agricultural research institutions worldwide
About Plant-Ditech
Plant-Ditech is a pioneer in plant physiology monitoring instrumentation with 15+ years of experience developing research-grade and production-grade systems for greenhouse, orchard, vineyard, and field crop applications. Our systems and methodologies have contributed to peer-reviewed research at universities and institutes across Europe, North America, Asia, and the Middle East. The PlantArray platform and associated sensor portfolio are the tools of choice for researchers requiring publication-grade data and for growers seeking actionable precision management capabilities. Plant-Ditech systems have been validated in trials spanning more than 50 crop species across 6 continents.