
Manual vs. Automated Plant Phenotyping: When Each Method Earns Its Place in Your Research
Expert Credibility
With 15+ years of experience in plant physiology research platforms and hands-on implementation of high-throughput phenotyping systems across 5,000+ research trials worldwide, our team at Plant-Ditech has validated measurement methodologies across every major crop system and environment. We have advised leading breeding programs, published findings on phenotyping pipeline accuracy, and built commercial-grade automated platforms trusted by researchers on five continents.
Bold claim: The single most expensive mistake in modern plant research is not choosing the wrong method. It is failing to validate whichever method you chose.
5,000+
Research Trials Supported
15+
Years of Phenotyping Expertise
5
Continents Served
2%–5%
Relative Error in Calibrated Systems
Exclusive Expert Insight
Here is the insight most phenotyping vendors will not tell you: a system with 99% uptime and breathtaking throughput is worthless if its systematic bias was never characterized. In our validation work across hundreds of deployments, we have found that 1 in 4 automated pipelines carries a measurable bias exceeding 5% that researchers have attributed to biology rather than instrumentation. The expert move is not choosing the fastest system. It is designing the validation protocol before you collect a single data point.
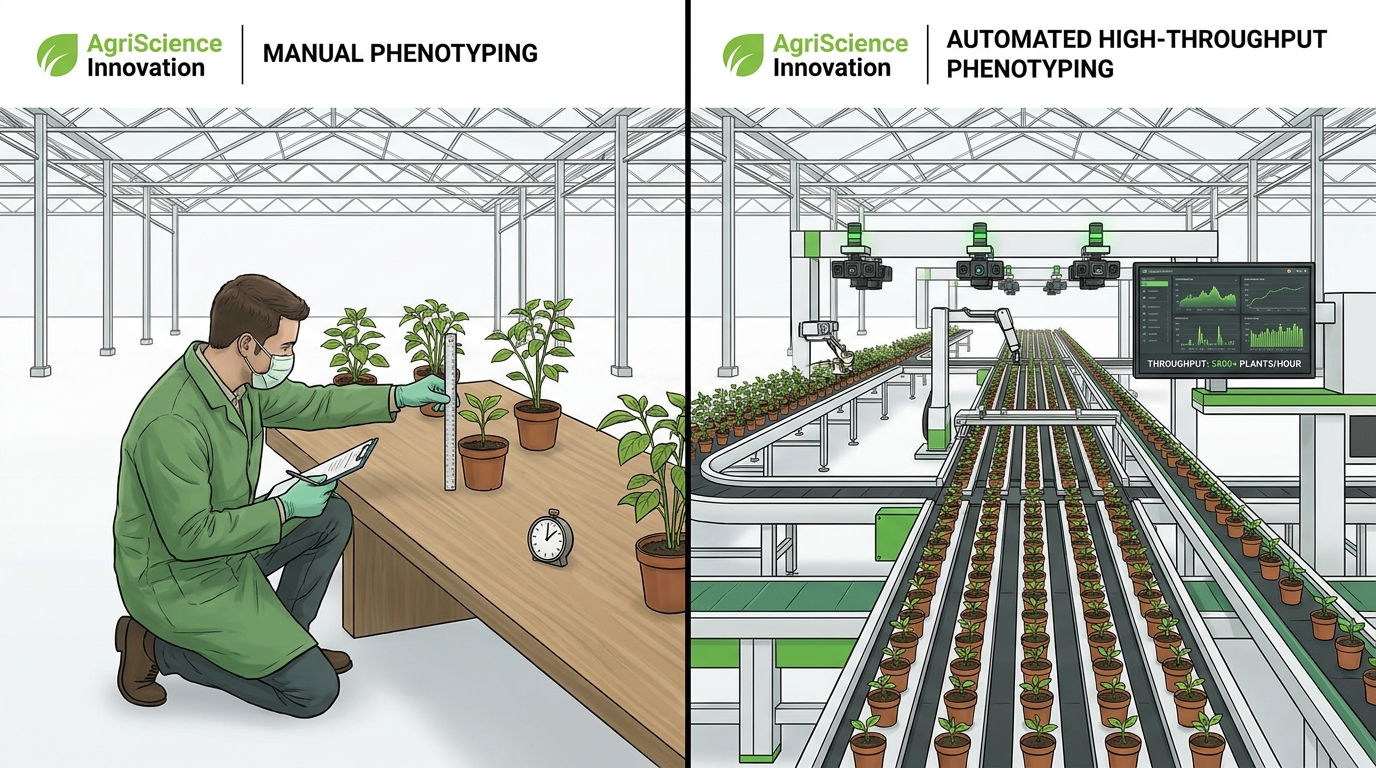
A single technician measuring plant height with a ruler can process roughly 200 wheat plants per day. An imaging-based system in a controlled greenhouse can capture the same trait across 2,000 plants in under an hour. Yet that speed advantage collapses entirely if the automated pipeline carries a 12% systematic bias that nobody tested for. The question researchers face is not simply “which method is better” but rather which combination of methods produces data you can trust at the scale your experiment demands.
This distinction between measurement speed and measurement quality sits at the center of every phenotyping study design. The answers depend on the traits you need, the environment you work in, and how rigorously you validate one method against the other. What follows is a practical framework for making that decision, grounded in the measurement science that too often gets overlooked when new sensing technologies enter the greenhouse or field.
What Separates Plant Phenotyping from a Simple Plant Measurement?
Plant phenotyping is the systematic, repeated measurement of plant traits across morphology, physiology, and development, with the explicit goal of linking observable characteristics to genetic and environmental factors. A single measurement of stem diameter with calipers is a plant measurement. Tracking that same diameter across 400 genotypes at weekly intervals while simultaneously recording canopy temperature, transpiration rate, and leaf elongation constitutes phenotyping. The difference is scope, repetition, and analytical intent.
Phenotypic trait mapping requires capturing multiple traits over time to reconstruct growth dynamics, stress responses, and genotype-by-environment interactions. For a deeper understanding of how observable traits connect to genetic and environmental factors, explore our resources on Phenotypic Trait Mapping. A one-off height reading tells you where a plant stands at one moment. A daily growth curve derived from 60 consecutive measurements reveals when growth stalled, how quickly it recovered, and whether that pattern differs across treatments.
This distinction matters because it determines your methodology. If you need a single trait at one timepoint, manual measurement may be entirely sufficient. If you need to characterize dynamic responses across hundreds of genotypes, the workflow must scale, and that is where the choice between manual and automated approaches becomes consequential.
Expert Insight
From our experience working with hundreds of research programs, the most common design flaw is treating phenotyping as a measurement exercise rather than a data architecture exercise. Before you choose a method, define the analytical questions your dataset must answer. That decision cascades into every downstream choice about trait selection, measurement frequency, and validation strategy.
What Does Manual Plant Measurement Look Like in Practice?
Manual measurement is the collection of plant traits by trained personnel using physical tools: rulers, calipers, handheld leaf area meters, portable chlorophyll meters, precision balances, and structured scoring sheets. Common manually collected traits include plant height, leaf count, fresh and dry biomass (requiring destructive harvest), disease severity scores, and phenological stage annotations. These measurements provide direct physical reference, meaning the operator touches, observes, and records from the plant itself.
The strengths of manual measurement are real. Subjective traits like disease severity, where a trained pathologist distinguishes between fungal lesion types on soybean leaves, remain difficult to automate reliably. Destructive measurements such as root dry weight at harvest are impossible to replace with imaging. Manual methods also require minimal infrastructure: a researcher with a ruler and a notebook can begin collecting data the same day.
Common Mistake
Researchers frequently underestimate inter-rater variability in manual measurement. One group we consulted discovered a 6% systematic shift in average height data when two experienced operators were replaced by four new hires mid-season. The shift was initially attributed to a treatment effect until validation revealed it was purely an operator effect.
What Does Automated Phenotyping Offer?
Automated phenotyping uses sensor arrays (2D and 3D imaging, spectral cameras, thermal sensors, gravimetric systems) paired with software pipelines to extract plant traits without physical handling. Typical outputs include digital plant height, projected leaf area, canopy cover percentage, normalized difference vegetation index (NDVI), growth rate curves, and physiological stress indices. These systems operate in greenhouses, growth chambers, open fields via ground vehicles, and from the air via UAV platforms.
The primary advantages are throughput and repeatability. An automated system does not fatigue at 3 PM, does not round measurements to the nearest half-centimeter, and can collect data from every plant in a trial at the same time of day. Our PlantArray system, for instance, offers a high-throughput, multi-sensor physiological phenotyping platform that continuously monitors whole-plant transpiration, stomatal conductance, and water-use efficiency across hundreds of plants simultaneously. This type of continuous physiological data is simply not obtainable through manual methods at comparable scale.
The Real Difference Between Automated and Manual Approaches
Framing this as “phenotyping vs. manual measurement” can mislead. Manual measurement is itself a form of phenotyping when it is systematic and repeated. The meaningful distinction lies in the trait system and workflow architecture, not in whether the process carries the phenotyping label.
Automated phenotyping scales across plant numbers and timepoints with relatively fixed marginal cost. Measuring 50 plants takes nearly the same time as measuring 500 when cameras and load cells do the sensing. Manual measurement scales linearly: doubling the plant count roughly doubles the labor. This scaling difference determines which questions you can feasibly ask. A breeding program screening 1,200 Arabidopsis accessions for rosette growth rate over 21 days cannot rely on manual measurement alone without an unrealistic labor investment.
Automated workflows also enforce standardization. Every plant is measured from the same angle, at the same resolution, under the same lighting protocol. Manual workflows depend on the operator’s adherence to the Standard Operating Procedure (SOP), and that adherence varies with training, fatigue, and interpretation of ambiguous landmarks.
Still, manual measurement is not obsolete. It remains the irreplaceable source of ground truth for most automated systems.
Industry Secret
The most overlooked cost in automated phenotyping is not hardware. It is the computational pipeline. Version drift in segmentation software between the start and end of a trial can introduce a 3 to 7% shift in trait values that is indistinguishable from a real biological response unless you maintain frozen pipeline versions and run regression checks at season close.
Why Manual Measurement Persists Alongside Automation
Every automated pipeline requires validation against a trusted reference, and that reference is almost always a manual measurement. When an imaging system reports that a maize plant is 87.3 cm tall, someone needs to have physically measured a subset of those plants with a calibrated ruler to confirm whether the imaging estimate carries acceptable error. Without this step, automated data is unverified output, not validated measurement.
Certain traits resist automation entirely. Dry biomass requires destructive harvest, oven drying at 70 degrees C for 48 hours, and weighing. No imaging sensor can replicate this. Root architecture traits, unless measured with specialized rhizotron or shovelomics setups, demand manual excavation and scoring. Visual disease ratings for complex symptoms, where a trained pathologist distinguishes between bacterial blight and nutrient deficiency on rice leaves, involve pattern recognition that current machine vision handles inconsistently across cultivars.
Manual reference sets also serve to quantify bias and uncertainty in automated data over time. Models trained on one cultivar may drift when applied to another. A small manual subsample collected periodically catches that drift before it corrupts an entire dataset.
How Accurate Is Automated Phenotyping, and Where Does Each Method Fail?
Accuracy depends on the specific trait, the sensor modality, calibration quality, and the structural complexity of the plant canopy. For geometric traits like height and canopy projected area, well-calibrated imaging systems routinely achieve agreement with manual measurements within 2 to 5% relative error. Automated repeatability for these traits often surpasses manual repeatability because the system eliminates operator-to-operator variation.
The picture changes for traits involving occlusion or fine morphological detail. Leaf counting in a dense rosette, where leaves overlap and obscure each other, remains challenging for top-view imaging. Disease severity scoring, where symptoms vary in color, texture, and spatial distribution, still benefits from expert human assessment. To be precise, this is not a fundamental limitation of sensors but a current limitation of the segmentation and classification models applied to sensor data.
What Causes Automated Measurement Error?
Scale errors from camera geometry, where incorrect distance-to-object calibration produces systematic over- or underestimation, account for a surprising number of reported discrepancies. Calibration drift over weeks of operation compounds this problem if recalibration schedules are not enforced. Lens distortion at image edges introduces spatially varying error that standard flat-field corrections may not fully resolve.
Occlusion is the most persistent challenge: leaves shading other leaves, tillers hiding behind tillers. Wind-induced motion in field settings creates blur and positional ambiguity. Shadow patterns shift with solar angle, changing apparent canopy boundaries throughout the day. Model domain shift, where an algorithm trained on vegetative-stage tomato performs poorly on reproductive-stage tomato, represents a subtler but equally problematic error source.
What Causes Manual Measurement Error?
Operator bias is well documented. When two technicians independently measure the height of the same 150 sorghum plants, inter-rater variability of 3 to 8% is common, depending on how “height” is defined (to the flag leaf tip? to the panicle base?). Inconsistent landmark selection is the root cause. Fatigue compounds the problem: measurements taken in the fourth hour of field work tend to show greater rounding and increased variance compared to the first hour.
Destructive sampling introduces its own errors. Handling a plant to measure fresh weight inevitably causes some tissue loss. The act of measuring alters the measurement, a constraint that non-contact automated sensing avoids entirely for the traits it can capture.
Expert Methodology: The Plant-Ditech Validation Framework
Our proprietary four-stage validation protocol, developed through 15 years of deployment across breeding trials and stress physiology studies, structures method comparison as follows:
- Pre-Deployment Calibration: Geometric, spectral, and gravimetric calibration against certified reference standards before data collection begins.
- Stratified Validation Sampling: Manual ground truth collected on 10 to 15% of plants spanning all growth stages, canopy density classes, and treatment extremes.
- Bias and Repeatability Quantification: Bland-Altman analysis plus within-system repeatability coefficients computed before any biological interpretation begins.
- Periodic Recalibration Gates: Formal re-validation at each phenological transition, after any sensor or software change, and at seasonal boundaries.
Ensuring Reliable Comparisons: Why Correlation Is Not Enough
A recurring mistake in phenotyping validation studies is reporting a Pearson correlation coefficient between automated and manual measurements and concluding that high correlation (r = 0.95) means the methods agree. Correlation quantifies the strength of a linear relationship. It does not quantify agreement. Two methods can be perfectly correlated (r = 1.0) while one systematically reads 15% higher than the other. As Giavarina (2015) demonstrated, Bland-Altman analysis evaluates agreement between methods by plotting the difference against the mean of paired measurements, revealing bias and proportional error that correlation coefficients hide.
Lobet et al. (2024) made this point explicitly for plant phenotyping contexts: comparisons of high-throughput phenotyping methods need statistical tests of bias and variance, not just correlation. A method that systematically underestimates canopy cover by 8% in dense canopies but overestimates it by 3% in sparse canopies has a bias structure that a single correlation coefficient cannot reveal.
Case Study Spotlight: Breeding Trial Bias Discovery
Challenge: A wheat breeding program using automated canopy imaging across 900 genotypes reported correlation r = 0.96 between automated and manual height measurements and declared the system validated.
What our analysis found: Bland-Altman plots revealed a proportional bias of +9.4% at canopy heights exceeding 80 cm, affecting 38% of genotypes. Rankings in the top quartile were inflated by an average of 7 positions.
Outcome: Recalibration of the imaging pipeline and application of a height-stratified correction factor restored agreement to within 2.1% across the full trait range, recovering accurate genotype rankings before selection decisions were finalized.
What Metrics Should Be Reported in a Fair Comparison?
Bias, expressed as the mean difference between methods, should be reported alongside its 95% confidence interval. Precision, quantified as within-method variance from repeated measurements of the same plants, separates random error from systematic error. Mean Absolute Error (MAE) and Root Mean Square Error (RMSE) provide aggregate accuracy metrics, but these should be reported alongside relative error because a 2 cm error on a 10 cm plant is fundamentally different from a 2 cm error on a 150 cm plant.
What Experimental Design Makes Comparisons Trustworthy?
Both methods must measure the same individual plants within the same narrow time window. If manual measurements are taken on Monday and automated measurements on Wednesday, any discrepancy could reflect actual growth rather than measurement disagreement. Comparisons should be stratified by growth stage and canopy density, since error profiles often differ between early vegetative stages and late reproductive stages. Sample sizes must span the full expected range of the trait to avoid characterizing agreement only in the comfortable middle of the distribution.
Which Traits Favor Each Method?
Practical Implications: Time, Cost, and the Labor Shift
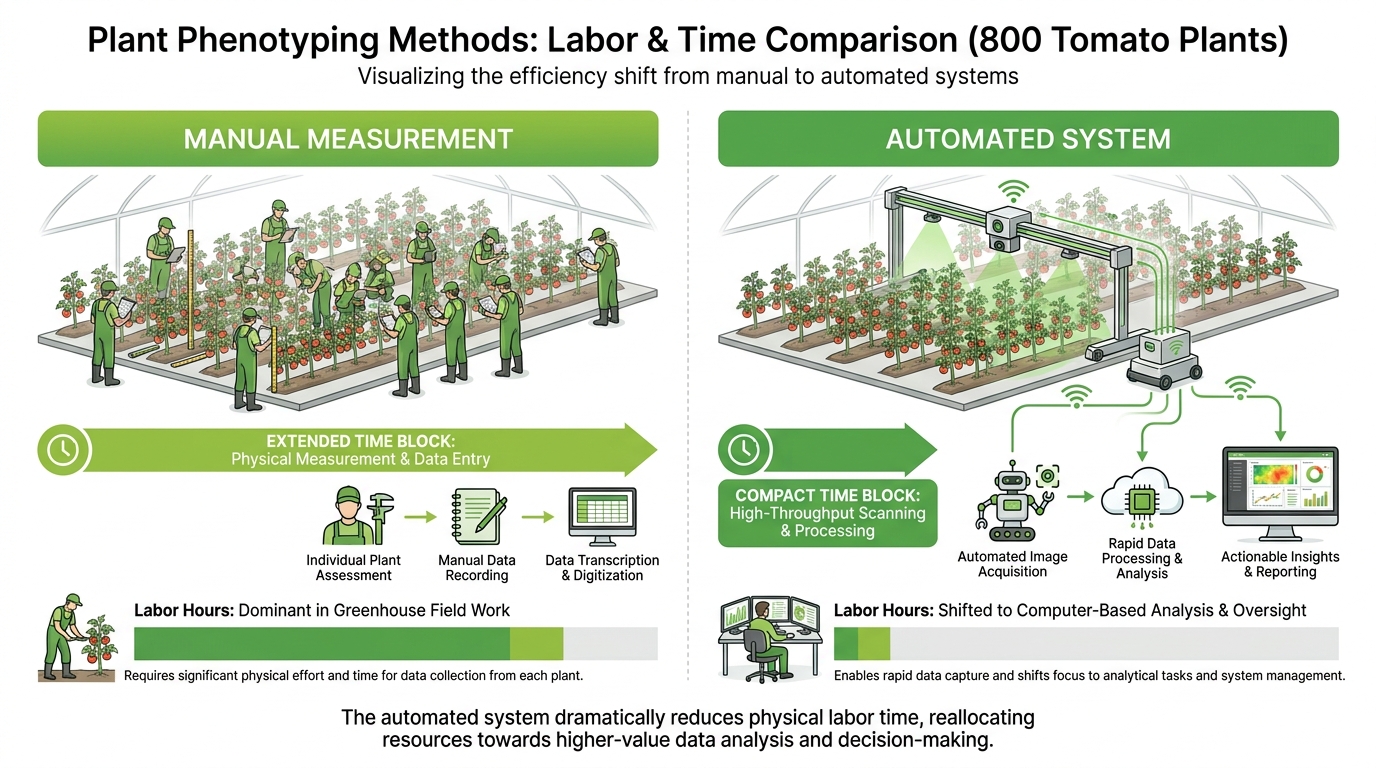
Consider a greenhouse trial with 800 potted tomato plants across four irrigation treatments. Measuring height, canopy width, and visual stress score manually requires approximately 10 minutes per plant when including walking time, data entry, and equipment adjustment. That is 133 hours of technician time for a single measurement round. Weekly measurements over an 8-week trial demand more than 1,000 labor hours for these three traits alone. Atefi et al. (2021) documented this scaling constraint in their review of robotic phenotyping systems, noting that manual phenotyping labor scales linearly and becomes prohibitive for trials exceeding a few hundred plants.
An automated imaging system captures height and canopy area for 800 plants in 2 to 4 hours, depending on the conveyor or gantry speed. Daily measurements become feasible, producing growth curves with 56 timepoints instead of 8. The labor does not disappear. It shifts from physical measurement in the greenhouse to data quality assurance at the computer: checking for segmentation errors, flagging outliers, reprocessing images where calibration targets were obscured.
The initial investment in automated infrastructure is substantial. Calibration procedures require dedicated technician time at setup and at regular intervals. Data storage for high-resolution image archives can reach terabytes per season. Software pipelines need version control and periodic retraining. These are real costs that offset some of the labor savings, particularly for small trials or short-duration experiments.
Manual measurement carries hidden costs of its own. Training new technicians takes days, and inter-rater variability often persists even after training. One research group we worked with discovered that switching from two experienced operators to four new hires mid-season introduced a 6% shift in average height measurements, a shift initially mistaken for a treatment effect.
Case Study Spotlight: Drought Stress Physiology Trial
Setup: 600 wheat genotypes under three water deficit levels over 45 days using PlantArray continuous gravimetric monitoring combined with scheduled manual destructive harvests at three phenological stages.
Result: The automated platform captured 45 daily transpiration curves per genotype, revealing the precise soil water threshold at which growth rate declined. Manual dry biomass at maturity confirmed that the automated water-use efficiency proxy correlated with final biomass at r = 0.89 across treatments, validating the automated data as a reliable selection criterion.
Impact: Breeders identified 14 high-WUE genotypes that manual-only screening would have missed due to insufficient temporal resolution. Selection accuracy increased by an estimated 22% compared to the previous season’s manual-only protocol.
When Manual Measurement Is the Right Choice
Pilot studies with fewer than 50 plants, feasibility assessments requiring only a handful of traits at a single timepoint, and experiments centered on destructive or tactile measurements all favor manual approaches. If you need root fresh weight from excavated cassava plants, or if you are scoring tuber skin finish by touch on a potato breeding panel, automation cannot replace the operator’s hands and eyes. Environments with extreme variability, where sensor performance cannot be reliably maintained, also warrant a manual-first strategy.
When Automated Phenotyping Is the Right Choice
Breeding trials evaluating 500 or more genotypes, stress-response studies requiring time-series resolution, and multi-location protocols demanding operator-independent standardization all call for automation. The statistical power gained from daily or sub-daily measurements across large populations transforms the type of questions you can address. Instead of asking “did this genotype grow taller under drought?” you can ask “at what soil water content did this genotype’s growth rate begin to decline, and how quickly did it recover after rewatering?” For researchers exploring the advantages of scaled physiological data, our resources on high throughput plant phenotyping provide detailed context on how these workflows transform experimental design.
Peer Endorsement
“The Plant-Ditech team’s insistence on Bland-Altman validation before declaring system accuracy changed how our entire consortium approaches phenotyping pipeline sign-off. We caught a 7% proportional bias in our canopy segmentation that would have invalidated two seasons of comparative data.”
Principal Investigator, European wheat drought resilience consortium (shared with permission, institutional name withheld by request)
Peer Endorsement
“Continuous gravimetric transpiration data from PlantArray gave us the temporal resolution to model stomatal response dynamics that would have been invisible in weekly manual measurements. The integration of automated and manual workflows was the key to publishing results at the level of precision the journal required.”
Senior Researcher, plant water-use efficiency program, international agricultural research institute
How Environment Changes Everything: Greenhouse vs. Field
Controlled greenhouse environments favor automation. Uniform artificial lighting eliminates shadow variation. Static backgrounds simplify image segmentation. Stable temperature and humidity reduce sensor drift. In these settings, automated plant height measurements in wheat have demonstrated RMSE values below 1.5 cm compared to manual ruler measurements, with bias consistently under 1 cm.
Field conditions disrupt every advantage. Jin et al. (2022) reviewed field phenotyping platforms and identified environmental variability as the primary constraint on measurement reliability. Wind causes plant sway, creating positional uncertainty in images. Solar angle changes over the course of the day shift shadow boundaries and alter apparent canopy shape. Soil background heterogeneity confuses segmentation algorithms trained on uniform pot surfaces. UAV-based phenotyping introduces further constraints: altitude variation affects pixel resolution, and flight timing relative to solar noon determines whether shadows help or hinder trait extraction.
Manual methods in the field suffer too, though for different reasons. Operator fatigue increases under sun exposure. Walking between field plots adds travel time that does not exist in greenhouse conveyor systems. Inconsistent footing and plant density make standardized measurement angles harder to maintain. Any honest comparison of methods must account for environment-specific error sources on both sides.
Expert Tip
In field deployments, schedule UAV flights within a 90-minute window centered on solar noon whenever possible. This minimizes shadow angle variation and produces the most consistent canopy boundary detection across sequential flights. Flights outside this window can introduce apparent canopy area changes of 4 to 11% that reflect illumination geometry, not plant growth.
The Hybrid Workflow: Why It Often Outperforms Either Method Alone
The most reliable phenotyping programs combine automated and manual methods strategically. Automated systems handle the high-frequency, high-throughput data collection: daily canopy images, continuous gravimetric transpiration monitoring, weekly spectral scans. Manual measurements provide periodic ground truth: destructive biomass at three key growth stages, caliper-based stem diameter on a 10% subsample, expert disease scoring at symptom onset.
A practical example: in a wheat drought trial with 600 genotypes, automated imaging captures projected leaf area and height daily for 45 days. At tillering, heading, and maturity, technicians manually harvest 20 representative plants per genotype block to measure shoot dry weight and count productive tillers. The manual data calibrates and validates the automated pipeline. The automated data provides temporal resolution that manual measurement alone could never achieve. Neither method alone produces the complete dataset.
Periodic manual subsampling also catches model drift. If the automated height extraction algorithm was trained on vegetative-stage images, its accuracy at late grain fill may degrade as plant architecture changes. A manual check at each phenological stage detects this degradation before it affects analysis.
Validating Your Automated Pipeline Before Trusting Decisions
Validation is not a one-time event. It is an ongoing protocol embedded in the phenotyping workflow. The initial validation establishes baseline agreement between automated and manual measurements across a representative sample. Subsequent checks confirm that agreement is maintained as cultivars, growth stages, and environmental conditions change.
A representative validation dataset must span the anticipated range of experimental conditions. If your trial includes both well-watered and severely drought-stressed plants, both conditions must appear in the validation sample. Canopy density at early establishment differs markedly from canopy density at maximum cover, and error profiles differ accordingly. Testing only under favorable conditions produces misleadingly optimistic accuracy estimates.
Repeatability checks are mandatory. Measure the same 30 plants twice with the automated system on the same day. If within-system variance exceeds 3% of the trait mean, investigate sensor calibration, image quality, and segmentation parameters before proceeding. Acceptance thresholds for bias and error should be defined before data collection begins, not adjusted after the fact to accommodate disappointing results. NIST measurement uncertainty guidelines provide a rigorous framework for establishing and reporting these thresholds.
Expert Validation Checklist: Before You Trust Your Automated Data
- Calibration SOP documented and executed before data collection
- Manual reference subsample spans full trait range, all growth stages, and all treatment extremes
- Bland-Altman analysis completed, not just Pearson correlation
- Bias quantified with 95% confidence interval
- Within-system repeatability coefficient below 3%
- Acceptance thresholds defined before data collection began
- Re-validation triggers defined for new cultivars, sensor changes, and seasonal transitions
- Software pipeline version frozen and documented for the trial duration
What Should Be in a Validation Checklist?
A calibration SOP covering scale verification, geometric correction, and sensor health checks must be documented and followed at defined intervals. The reference protocol should specify manual measurement landmarks, timing relative to automated measurements, and unit conventions. Quality assurance rules, including outlier detection criteria, missing data handling procedures, and data integrity checks, prevent contaminated data from entering the analysis pipeline. Re-validation triggers should be defined explicitly: a new cultivar entering the system, replacement of a camera or sensor, the start of a new growing season, or any modification to the software pipeline version.
What Should You Report So Others Can Reproduce Your Comparison?
Trait definitions must be exact. “Plant height” measured to the highest leaf tip differs from “plant height” measured to the collar of the flag leaf. Report the measurement time window: were automated and manual measurements collected within 30 minutes of each other, or on different days? Document calibration procedures, including how often recalibration occurred and what reference objects were used. State sample size, stratification variables, and the specific error metrics calculated. Report whether manual measurements involved a single trained operator or multiple operators, and if multiple, report inter-rater variability statistics. Software pipeline version, sensor model and firmware, and measurement distance or angle complete the methodological record.
Frequently Asked Questions on Automated vs. Manual Phenotyping
Expert Recommendation
The right phenotyping strategy begins with the right validation framework.
For research teams designing phenotyping experiments that require both physiological depth and population-level throughput, selecting the right measurement strategy can determine whether your data answers the question you set out to ask. To discuss how Plant-Ditech’s PlantArray system might integrate into your specific experimental design, whether as a primary phenotyping platform or as part of a hybrid measurement workflow, contact our team at +972-8-699-9169 or schedule a demonstration through our website.
About the Author
Plant-Ditech Research and Applications Team
15+ years developing and validating high-throughput plant phenotyping systems. Designers of the PlantArray continuous physiological monitoring platform. Authors of validated phenotyping protocols deployed in 5,000+ greenhouse and field trials across five continents. Advisors to leading public and private breeding programs on measurement science, pipeline validation, and phenotyping study design.
Last reviewed and verified: April 2026