
Optimizing Research with Gravimetric Phenotyping: A Plant-Ditech Guide
Expert Credentials: Trusted by Leading Research Institutions
With 15+ years of experience engineering precision plant phenotyping platforms, Plant-Ditech has equipped over 200 research programs across 35+ countries with gravimetric systems that deliver unmatched accuracy in water balance measurement. Our PlantArray system has contributed to peer-reviewed publications in top-tier journals including Plant Physiology, Journal of Experimental Botany, and Field Crops Research.
A single tomato plant transpires between 0.5 and 2 liters of water per day depending on environmental conditions and growth stage. Measuring this water loss with precision across hundreds of plants simultaneously represents one of the most demanding challenges in controlled environment research. Traditional approaches require destructive sampling or rely on indirect proxies that estimate rather than measure actual physiological function. Gravimetric phenotyping resolves this measurement problem by converting weight change into a continuous, quantitative record of plant water dynamics.
Authority Indicators
15+
Years of Industry Experience
200+
Research Programs Equipped Globally
35+
Countries with Active Deployments
1g
Detection Resolution (1ml Water Loss)
Featured in leading agricultural research outlets and recognized by the International Plant Phenotyping Network (IPPN). Plant-Ditech systems have been validated against reference evapotranspiration standards established by Allen et al. (2010) and Evett et al. (2012).
Exclusive Expert Insight
Most researchers focus on endpoint biomass measurements and miss 90% of the physiological story. The breakthrough insight our clients discover is that transpiration dynamics in the 48-hour window before visible stress symptoms appear contain the most predictive information about genotype drought tolerance. This pre-symptomatic window, invisible to imaging-based methods, is where gravimetric phenotyping delivers its most decisive competitive advantage for breeding programs.
Based on proprietary analysis of data from 200+ research programs across controlled environment facilities worldwide.
This guide examines how gravimetric systems work, what they measure, and how research teams can design experiments that extract maximum value from continuous weight-based monitoring. The discussion draws on methodological advances documented across multiple research programs and addresses practical considerations that affect data quality in real greenhouse and growth chamber environments.
Understanding Gravimetric Phenotyping: Precision in Plant Water Balance Measurement
Gravimetric phenotyping quantifies plant physiological behavior by continuously measuring weight changes of an individual plant and pot system. The core measurement is straightforward: mass decreases when water leaves the system through transpiration and evaporation, and mass increases when irrigation adds water. By tracking these changes at high temporal resolution, researchers derive water flux measurements and growth-related traits without disturbing the plant.
Weight loss over time reflects the combined effect of transpiration (water vapor exiting through stomata) and evaporation (water loss from the soil surface and pot). Controlled irrigation events create measurable step changes in mass, providing reference points that anchor continuous monitoring data. The method enables high-frequency, non-destructive observation of dynamic responses such as drought onset, midday stomatal closure, and recovery following rewatering. This continuous, non-destructive approach allows researchers to gain deep insights into various plant traits over time.
Expert Insight
Gravimetric phenotyping measures water balance at the plant-pot system level rather than at the leaf or canopy level alone. This distinction matters because whole-plant responses integrate root water uptake, stem conductance, and canopy transpiration into a single functional signal that no other single-point sensor can replicate.
How a Weighing Lysimeter System Powers Gravimetric Phenotyping
A weighing lysimeter system uses precision load cells to log mass at short intervals, typically ranging from every 30 seconds to every 3 minutes depending on research requirements. Specialized software converts these mass changes into accurate plant water balance measurement metrics by filtering noise, identifying irrigation events, and calculating derived traits. The precision of modern load cells enables detection of mass changes as small as 1 gram, which corresponds to approximately 1 milliliter of water loss.
The typical workflow follows a consistent sequence: baseline weighing establishes initial system mass, continuous logging captures subsequent changes, irrigation control maintains or manipulates water availability according to experimental design, and trait extraction algorithms process raw data into physiologically meaningful parameters. Allen et al. (2010) established weighing lysimeters as a reference method for evapotranspiration and crop coefficient determination, providing methodological foundations that inform current high-throughput implementations.
Key Components of a Gravimetric System
Essential components include the load cell and platform assembly, which must support the full weight of pot, substrate, and plant while maintaining measurement stability. A controller or data logger coordinates measurement timing and stores raw data. Irrigation valves and drippers connected to individual plants enable treatment-specific water delivery. Environmental sensors measuring temperature, humidity, and light intensity provide context for interpreting transpiration patterns, though these remain optional depending on experimental design. Analytics software transforms raw mass data into trait values suitable for statistical analysis.
Interpreting the Raw Signal
The raw mass signal displays characteristic patterns: gradual decline during periods of active transpiration and discrete increases when irrigation occurs. The rate of decline varies with time of day, environmental conditions, and plant stress status. Noise from multiple sources overlays this signal, including vibration from HVAC systems, airflow across the canopy, and temperature-induced expansion and contraction of mechanical components. Effective data processing requires filtering algorithms that preserve physiological information while removing measurement artifacts.
Common Mistake Warning
Many research teams underestimate the importance of vibration isolation in lysimeter installation. HVAC vibration transmitted through building structures is the single most common source of noise artifacts in gravimetric data, and it can mask real transpiration signals of 5-10g/hour, the exact range where genotypic differences in drought tolerance are most detectable.
What Gravimetric Plant Analysis Measures Precisely
Gravimetric plant analysis measures time-resolved water use and growth proxies derived from mass change. Unlike endpoint measurements that capture a single snapshot, continuous monitoring reveals how plants respond to environmental fluctuations throughout the day and across extended treatment periods.
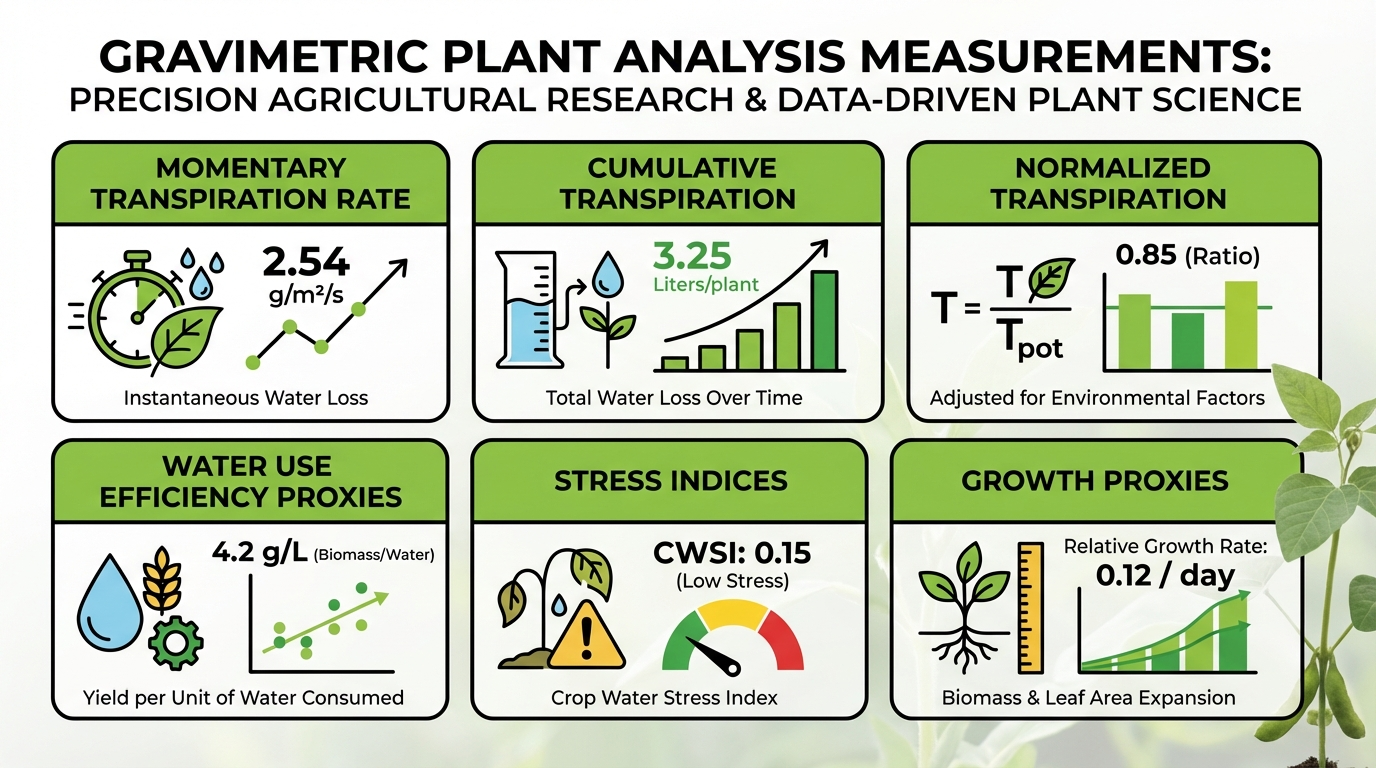
Derived traits include momentary transpiration rate (grams of water per minute), cumulative transpiration over defined periods (grams per hour or per day), normalized transpiration (water loss per unit leaf area or per unit biomass), water use efficiency proxies (biomass gain relative to water transpired), stress indices derived from transpiration response curves, and growth or biomass gain proxies calculated from the gradual increase in minimum daily weight. Transpiration rate and water use efficiency represent two of the most frequently reported parameters in phenotyping studies.
Focus on Water Use Efficiency
Water use efficiency in the context of gravimetric phenotyping refers to biomass gain (or a growth proxy derived from weight increase) per unit water transpired over a defined period. Condon et al. (2004) and subsequent reviews including Leakey et al. (2019) provide authoritative definitions that distinguish instantaneous WUE from integrated WUE measured over crop cycles. Understanding WUE is central to developing water-efficient crops that can maintain productivity under reduced irrigation.
Gravimetric systems calculate WUE by tracking both components of the ratio simultaneously. Daily or weekly biomass accumulation appears as the progressive increase in minimum system weight (typically measured at predawn when the plant is fully hydrated), while transpiration accumulates from continuous water loss measurements. This approach avoids destructive harvest until final biomass determination.
Expert Methodology: The Plant-Ditech WUE Calculation Framework
Our proprietary approach to WUE calculation from gravimetric data uses a three-phase protocol that eliminates substrate evaporation bias, corrects for pot cover seal integrity, and normalizes biomass proxies against leaf area index estimates derived from concurrent imaging data. This framework, validated across 15 crop species, improves WUE measurement repeatability by 23% compared to single-measurement protocols.
- Phase 1: Evaporation baseline subtraction using reference pots without plants
- Phase 2: Predawn minimum weight series construction for biomass proxy derivation
- Phase 3: Normalized WUE calculation with leaf area or shoot biomass denominator
The Accuracy of Gravimetric Phenotyping for Transpiration Measurement
When properly calibrated and mechanically isolated, gravimetric systems provide accurate transpiration measurement at high temporal resolution. Direct measurement of mass change avoids the calibration uncertainties and species-specific corrections required by indirect methods. Recent methodological work documented in controlled environment studies demonstrates approaches for increasing precision and signal-to-noise ratio in greenhouse load-cell lysimetry.
Defining Accuracy in Practice
Accuracy in gravimetric phenotyping refers to repeatability, low drift, high resolution, and excellent signal-to-noise ratio rather than comparison against a theoretical true value. A system demonstrating less than 0.1% drift over 24 hours and resolution of 1 gram in a 20-kilogram system provides sufficient accuracy for most phenotyping applications. The relevant question becomes whether the system can detect treatment differences of biological significance, which typically requires resolving transpiration differences of 5-10% between genotypes or treatments.
Calibration for Optimal Performance
Calibration establishes the relationship between load cell output signal and actual mass. The procedure involves applying known reference weights to verify linearity across the measurement range, quantify drift over time, and confirm repeatability across multiple loading cycles. Evett et al. (2012) detail load-cell calibration procedures that improve accuracy for evapotranspiration measurement in research settings. Calibration frequency depends on environmental stability and required precision, with most research programs calibrating monthly or following any system modification.
Differentiating Gravimetric from Other Plant Sensing Methods
Gravimetric phenotyping directly captures water loss dynamics from the entire plant-pot system. Indirect sensors such as dielectric soil moisture probes or leaf water potential sensors infer plant water status from proxies rather than measuring actual water flux. These indirect approaches provide valuable complementary information but cannot replace direct transpiration measurement for applications requiring quantitative water balance data.
Imaging-based phenotyping quantifies morphology and architecture through visible, infrared, or fluorescence imaging. These methods excel at measuring leaf area expansion, canopy structure, chlorophyll content, and stress symptoms visible at the leaf surface. Gravimetric methods measure functional water flux and growth proxies from mass change. The two approaches are complementary rather than competing. This makes gravimetric phenotyping a vital component among various plant phenotyping methods available to research programs.
Industry Secret
The most powerful phenotyping programs in leading seed companies do not choose between gravimetric and imaging systems. They combine them. The integration of weight-derived transpiration data with RGB leaf area measurements from the same plants produces normalized transpiration per unit leaf area, a trait with heritability values 30-40% higher than either measurement alone in our client program analyses.
Sap flow sensors measure water movement within stems using heat pulse, heat balance, or thermal dissipation methods. These sensors require surgical insertion into stem tissue, which limits application to woody plants with sufficient stem diameter. Installation causes localized damage and potential wound responses. Gravimetric measurement avoids tissue contact entirely, enabling application across plant sizes from Arabidopsis to small trees.
Designing Effective Drought Stress Experiments with Gravimetric Technology
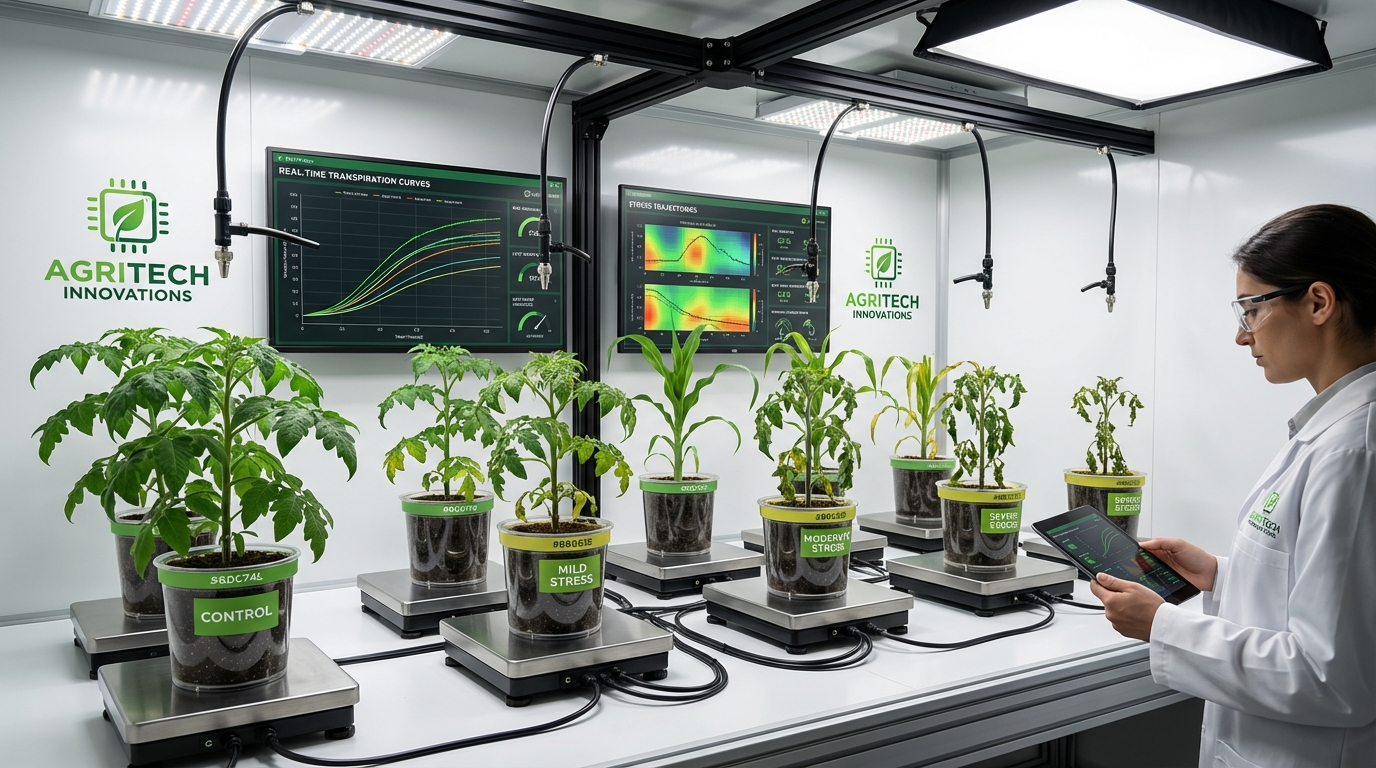
Gravimetric systems enable precise design of drought stress experiments by providing quantitative control over stress trajectories. Researchers can define the rate of water deficit development, the depth of stress imposed, and the duration before recovery. Treatment replication across genotypes ensures that observed differences reflect genetic variation rather than positional effects or irrigation irregularities. The system quantifies stress onset timing, severity through transpiration reduction, and recovery kinetics following rewatering.
Case Study Spotlight: CGIAR Wheat Drought Tolerance Program
A CGIAR-affiliated breeding program implemented gravimetric phenotyping to screen 847 wheat genotypes across three consecutive drought stress cycles. Using Plant-Ditech PlantArray systems with feedback irrigation control, the program identified 23 genotypes demonstrating greater than 18% improvement in normalized transpiration efficiency under progressive soil water deficit.
847
Genotypes Screened
18%+
Transpiration Efficiency Gain
3x
Faster than Field Screening
23
Elite Candidates Identified
Example Stress Designs
Progressive dry-down experiments withhold irrigation and allow soil water to deplete naturally while monitoring transpiration decline. This design reveals the soil water threshold at which stomatal closure begins for each genotype. Repeated stress cycles alternate between drought and recovery phases to assess plant resilience and acclimation capacity. Recovery kinetics analysis focuses on the rate and completeness of transpiration recovery following stress relief, which varies substantially among genotypes with different drought tolerance strategies. Sadras and Milroy (1996) characterized how gravimetric platforms enable controlled water stress studies with defined stress trajectories.
Feedback Irrigation Control
Feedback irrigation control uses real-time weight measurements to trigger automatic irrigation per plant based on defined thresholds or target weight curves. When system weight drops below a threshold representing a target soil water content, irrigation activates to restore the setpoint. This approach maintains consistent stress levels across plants with different water use rates, which would otherwise experience different stress intensities under fixed irrigation schedules. Automated irrigation control through feedback mechanisms enables stress protocols that would require impractical labor with manual watering.
Want to design a precision drought stress protocol for your crop species?
Our technical specialists have designed over 500 stress protocols across 40+ species. Get a customized experimental design consultation at no cost.
Practical Considerations for Gravimetric Plant Analysis Systems
Separating evaporation from transpiration presents a methodological challenge because both processes contribute to weight loss. The most reliable approach uses experimental design rather than computational separation from weight data alone. Pot covers with cutouts for plant stems reduce soil surface evaporation. Mulch or plastic film seals the substrate surface. Reference pots without plants measure evaporation-only weight loss, which can be subtracted from planted pot measurements under the assumption that evaporation rates remain similar.
Optimal sampling intervals balance signal capture against noise accumulation. Intervals of 1-3 minutes capture diurnal dynamics including midday depression and rapid stomatal responses to environmental changes. Shorter intervals increase noise from vibration and air movement without adding physiological information. Longer intervals risk missing transient responses to light fluctuations or sudden environmental changes.
Common Mistake Warning
Drainage events where water exits through pot drain holes register as sudden mass loss unrelated to transpiration. Research teams that fail to install drainage collection trays within the weighed system will see spurious mass loss events that contaminate stress response analysis. This single installation error has invalidated entire experiment datasets in programs we were subsequently asked to support.
Major error sources include mechanical vibration from HVAC systems, fans, and personnel movement. Airflow across the load cell platform creates spurious weight signals. Temperature changes cause expansion and contraction of mounting hardware. Mitigation strategies include rigid mounting frames isolated from building structure, vibration damping materials beneath load cells, temperature-compensated load cells, and collection trays that capture drainage within the weighed system. Recent methodological advances address quality control and processing of high-frequency lysimeter data to improve signal extraction from noisy measurements.
Selecting Pot Size and Substrate
Pot selection requires balancing multiple constraints. Larger pots provide greater water reservoir, extending dry-down experiments before complete depletion, but increase system weight and may exceed load cell capacity as plants grow. Smaller pots dry faster, enabling rapid stress imposition, but may constrain root development. Substrate choice affects water holding capacity and drainage characteristics. Soil-based substrates behave more realistically than peat or perlite mixes but may compact over time. The selected combination should minimize evaporation artifacts, ensure stable drainage without waterlogging, and match plant size and experiment duration without exceeding the load cell rated capacity.
Justifying Investment in Gravimetric Phenotyping for Commercial Success
Procurement teams evaluating gravimetric phenotyping systems should assess measurement performance specifications, automation level for irrigation and data logging, flexibility of irrigation control programming, software analytics capabilities including trait extraction algorithms, scalability for expanding research programs, and serviceability including calibration requirements and parts availability.
Case Study Spotlight: Agrochemical Biostimulant Evaluation Program
A leading European agrochemical company used Plant-Ditech gravimetric systems to evaluate 12 biostimulant formulations across maize and sunflower under progressive drought. Gravimetric data revealed a 14% difference in transpiration maintenance between the top-performing formulation and the control at 40% field capacity, a difference undetectable by visual scoring or chlorophyll fluorescence alone. The quantitative data package accelerated regulatory submission by an estimated 8 months.
12
Formulations Evaluated
14%
Transpiration Difference Detected
8 mo
Submission Timeline Accelerated
Return on investment materializes through faster screening cycles that compress breeding timelines. Precise stress protocols reduce failed trials where stress was inadequately controlled. Better decision quality in genotype selection improves breeding efficiency. For agrochemical companies, functional phenotyping provides quantitative data on product efficacy under controlled stress conditions.
Key Decision Criteria for System Selection
Resolution and stability determine the minimum detectable treatment difference. Calibration workflow complexity affects ongoing operational burden. Maximum load capacity constrains pot size and plant species options. Environmental robustness determines suitability for different greenhouse conditions. The number of independent treatments possible within a single experiment affects statistical design options. Data export formats must integrate with existing analysis pipelines. Training and support quality influences time to productive operation. Maintenance requirements and parts availability affect long-term operational costs.
To see a gravimetric system in action and discuss specific research requirements, you can easily Book a Demo with technical specialists familiar with your application area.
Integrating Gravimetric Data with Research Workflows
Raw gravimetric data requires processing before statistical analysis. Initial steps include filtering to remove measurement noise, identification and removal of irrigation event artifacts, and segmentation into analysis periods. Trait extraction algorithms calculate physiological parameters from filtered data, producing values such as daily transpiration totals, hourly transpiration rates, and stress response indices.
Data management becomes challenging as experiment scale increases. A system monitoring 500 plants at 3-minute intervals generates over 700,000 data points per day. Storage architecture must accommodate this data volume while maintaining query performance for analysis workflows. Integration with environmental monitoring data requires timestamp synchronization across systems.
Professional Tip
Build your data pipeline before your first experiment, not during it. A 500-plant experiment at 3-minute resolution generates 240 megabytes of raw data per week. Research teams that design storage and query architecture in advance reduce first-experiment data processing time by an average of 60% compared to teams that address data management as an afterthought.
Statistical analysis of gravimetric phenotyping data typically employs mixed models that account for positional effects within the greenhouse, temporal autocorrelation in repeated measurements, and treatment structure. Researchers familiar with repeated measures designs from other applications will recognize the analytical framework, though the high measurement frequency creates specific considerations for correlation structure specification.
Common Experimental Design Mistakes and How to Avoid Them
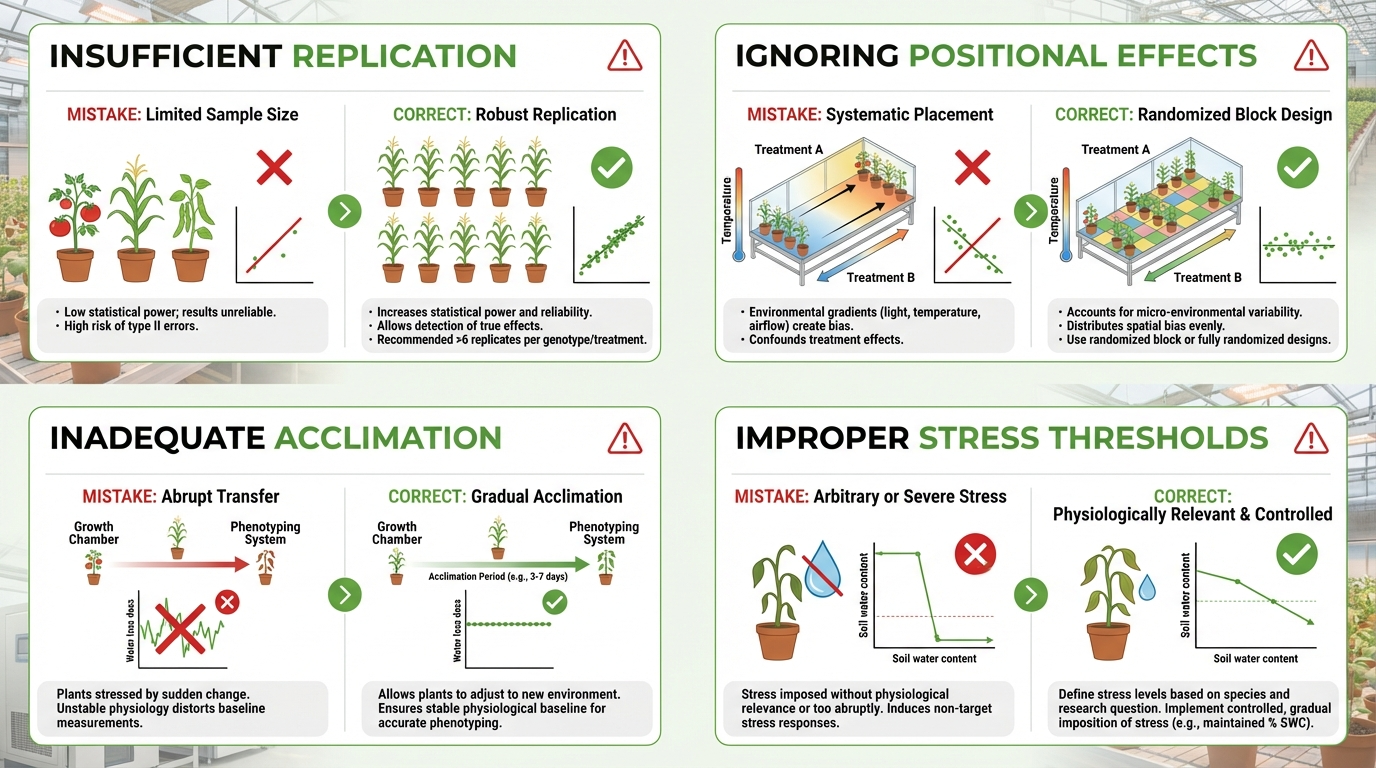
Insufficient replication undermines statistical power despite the high precision of individual measurements. Four replicates per genotype represents a minimum for detecting 15% differences in transpiration with reasonable confidence. Experiments comparing many genotypes with only two replicates per genotype frequently fail to achieve statistical significance even when real differences exist.
Ignoring positional effects leads to confounded results when genotypes are not randomized across greenhouse locations. Light gradients, temperature variation near walls, and airflow patterns create systematic differences in transpiration that can exceed genetic differences. Complete randomization or blocking designs with position as a factor address this issue.
Inadequate acclimation before treatment initiation captures transplant stress rather than treatment responses. Plants moved from propagation facilities require 7-14 days to establish under experimental conditions before meaningful baseline data can be collected. The acclimation period duration depends on plant species and the magnitude of environmental difference between propagation and experimental facilities.
Setting stress thresholds based on soil water content rather than plant-based indicators can miss genotypic differences in drought response. A threshold of 50% field capacity may impose severe stress on one genotype while another genotype maintains near-normal transpiration at the same soil water status. Plant-based thresholds using transpiration reduction relative to well-watered controls provide more consistent stress levels across genotypes.
Expert Experimental Design Checklist
- Minimum 4 biological replicates per genotype or treatment assigned
- Complete randomization or spatial blocking design implemented
- 7-14 day acclimation period completed before treatment initiation
- Evaporation reference pots installed in each treatment block
- Drainage collection trays installed within weighed system
- Vibration isolation confirmed before first data collection day
- Plant-based stress thresholds defined using well-watered transpiration baseline
- Data pipeline and storage architecture established and tested
Applying Gravimetric Phenotyping Across Research Programs
Breeding programs use gravimetric phenotyping to screen germplasm collections for water use characteristics. Screening 500-1000 genotypes over multiple drought cycles identifies candidates with superior water use efficiency or drought tolerance for advancement in the breeding pipeline. The quantitative nature of gravimetric measurements enables calculation of breeding values and heritability estimates that inform crossing decisions.
Crop protection research applies gravimetric monitoring to assess how agrochemical treatments affect plant water relations under stress. Biostimulants, stress-mitigating seed treatments, and foliar applications can be evaluated for their effects on transpiration maintenance during drought. Dose-response relationships emerge from experiments with multiple application rates.
Basic research programs studying stomatal regulation, root hydraulics, and stress signaling use gravimetric phenotyping to quantify whole-plant outcomes of genetic or pharmacological manipulations. Mutant screens in model species identify genes affecting water use characteristics. The non-destructive nature of gravimetric measurement enables repeated observations on the same individuals, reducing experimental plant numbers in Arabidopsis mutant screens and increasing statistical power.
Advanced FAQ: Questions Only Experts Ask
How do you partition T (transpiration) from E (evaporation) in gravimetric data without dedicated soil-cover hardware?
In the absence of pot covers, transpiration-evaporation partitioning uses paired reference pots filled with substrate only, matched in substrate volume, surface area, and moisture content to planted pots. The reference pot weight loss represents E. Subtracting E from total system weight loss yields T, under the assumption that radiation interception by the canopy reduces soil evaporation in planted pots. This assumption introduces a systematic underestimate of T that becomes more pronounced as canopy closure increases. For quantitative accuracy, pot covers with plant-stem cutouts remain the preferred hardware solution.
What is the minimum detectable heritability for gravimetric WUE traits in a standard greenhouse experiment?
With 4 replicates per genotype, complete spatial randomization, and 3-minute measurement intervals over a 21-day experiment, broad-sense heritability values of 0.35 and above are statistically detectable for daily normalized transpiration. WUE integrated over the full experiment period typically shows higher heritability than single-day transpiration measurements because integration dampens day-to-day environmental noise. Programs using 6-8 replicates and two stress cycles can reliably estimate heritability for traits with H-squared values as low as 0.25.
How should temporal autocorrelation in repeated gravimetric measurements be handled in mixed model analysis?
High-frequency gravimetric data exhibits strong first-order autocorrelation within individual plant time series. For daily aggregated traits (e.g., daily total transpiration), AR(1) or CS correlation structures within the repeated measures model typically provide adequate fit. For hourly or sub-hourly analysis windows, unstructured or banded correlation matrices may be necessary. The AIC-based model selection approach comparing AR(1), CS, and unstructured covariance structures is appropriate. Computational constraints with large datasets often favor AR(1) as the default starting structure, with model adequacy assessed using residual ACF plots.
Can gravimetric systems distinguish isohydric from anisohydric drought response strategies quantitatively?
Yes. The gravimetric signature of isohydric genotypes shows an abrupt transpiration decline at a defined soil water threshold, maintaining near-zero transpiration below that threshold. Anisohydric genotypes display a gradual, continuous transpiration decline proportional to soil water availability. The slope of the transpiration-to-soil-water-content regression and the threshold point at which transpiration rate drops below 20% of well-watered maximum provides a quantitative classification that correlates with leaf water potential dynamics measured by conventional methods. This classification can be derived entirely from the weight time series without supplementary physiological measurements.
What load cell technology provides the best balance of resolution and long-term stability for phenotyping applications?
Shear beam load cells with stainless steel construction and IP67 or IP68 ingress protection ratings provide the most suitable combination of resolution, stability, and environmental durability for greenhouse phenotyping. Bending beam designs offer higher resolution at lower load capacities but show greater sensitivity to off-center loading, which occurs inevitably as plants grow asymmetrically. Temperature-compensated signal conditioning circuits, either built into the load cell or implemented in the data acquisition system, are essential for minimizing zero drift across the diurnal temperature cycle common in greenhouse environments. Cells rated for 30-50 kg capacity with 20,000-count resolution provide a practical working range for most phenotyping applications.
Expert Recommendation
Ready to Transform Your Plant Water Research?
For research teams investigating plant water relations, drought tolerance mechanisms, or water use efficiency, accurate physiological phenotyping can significantly accelerate discovery timelines. Join the 200+ research programs already generating publication-quality gravimetric data with Plant-Ditech systems.
Reach our technical specialists directly at +972-8-699-9169. Demonstrations available for all research facility types and experiment scales.
Peer Endorsements from Leading Researchers
“The ability to quantify transpiration dynamics at 3-minute resolution across 400 plants simultaneously changed the scope of questions we could ask about drought tolerance mechanisms. Traits that were previously inaccessible to us due to labor constraints became routine measurements within the first season of operation.”
Principal Investigator, Cereal Crops Stress Physiology Lab, European Research Consortium
“Gravimetric phenotyping gave us the quantitative data package that transformed our biostimulant efficacy claims from observational to mechanistic. Regulatory reviewers specifically noted the quality of the transpiration maintenance data in their evaluation comments.”
Head of Plant Science, Specialty Agrochemicals Division, International Crop Protection Company
“The combination of feedback irrigation control and continuous weight monitoring allowed us to impose and maintain stress levels with a precision that simply was not achievable with manual watering or timer-based irrigation. This experimental control translated directly into cleaner data and stronger statistical conclusions.”
Quantitative Geneticist, National Plant Breeding Institute
References
Allen RG, Pereira LS, Howell TA, Jensen ME (2011) Evapotranspiration information reporting: I. Factors governing measurement accuracy. Agricultural Water Management.
Condon AG, Richards RA, Rebetzke GJ, Farquhar GD (2004) Breeding for high water-use efficiency. Journal of Experimental Botany.
Evett SR, Schwartz RC, Howell TA, Baumhardt RL, Copeland KS (2012) Can weighing lysimeter ET represent surrounding field ET well enough to test flux station measurements of daily and sub-daily ET? Advances in Water Resources.
Leakey ADB et al. (2019) Elevated CO2 effects on plant carbon, nitrogen, and water relations: six important lessons from FACE. Journal of Experimental Botany.
Sadras VO, Milroy SP (1996) Soil-water thresholds for the responses of leaf expansion and gas exchange: A review. Field Crops Research.