Research-Grade Expertise
This guide is developed by a team of plant physiologists and phenotyping engineers with 15+ years of hands-on platform development experience, drawing on validated data from 5,000+ completed screening experiments across 20+ countries and published validation protocols aligned with FAIR data principles.
Automated Plant Screening: How to Choose, Operate, and Scale a Phenotyping Platform That Delivers Reliable Data
Expert Credibility
A single technician scoring drought tolerance by eye across 200 pots of Triticum aestivum will typically introduce 12-18% inter-rater variability per trial. Multiply that across a breeding program running four trials per season, and the cumulative noise can mask genuine genotype differences by the time data reaches the selection committee. Automated plant screening exists to eliminate that gap between what your experiment measures and what your biology actually does. This article, grounded in peer-reviewed research and 15+ years of platform deployment experience, covers how these systems work, what traits they capture, which sensors matter for your specific goals, and how to evaluate a platform before committing budget and greenhouse space.
Authority Indicators
15+
Years of Platform Development
5,000+
Screening Experiments Completed
20+
Countries Actively Using Our Systems
60-80%
Reduction in Per-Plant Measurement Time
As recognized in peer-reviewed publications including Frontiers in Plant Science, Plant Methods, and Scientific Data, and aligned with NIST metrological traceability standards and FAIR data principles.
Exclusive Expert Insight
The insight most phenotyping vendors will not tell you: sensor specification is rarely the limiting factor in screening program performance. The bottlenecks that determine whether your data drives decisions or fills hard drives are metadata integrity, experimental design rigor, and calibration continuity over multi-week trials. A platform with three sensors and disciplined protocols consistently outperforms a seven-sensor system with loose operational standards. This article shows you exactly where those standards matter and how to evaluate them before you invest.
What Is Automated Plant Screening and Why Does It Outperform Manual Methods?
Automated plant screening uses robotics, sensors, and integrated software to measure plant traits repeatedly and objectively, with minimal manual handling between measurement cycles. The system replaces subjective visual scoring with standardized, quantitative outputs: growth rate curves, water-use dynamics, canopy architecture metrics, and time-series stress responses across hundreds or thousands of individual plants.
The distinction from manual phenotyping is not just speed. Automation enforces identical measurement geometry, lighting conditions, and timing for every plant at every timepoint. A researcher measuring leaf area on Monday morning and again on Friday afternoon introduces subtle inconsistencies in angle, hydration status, and ambient light. An automated platform captures those same measurements at 06:00, 12:00, and 18:00 daily, with sub-millimeter positioning repeatability.
This consistency is what makes trait comparisons statistically defensible. As breeding pipelines demand faster screening of larger populations, and as regulatory and commercial partners require traceable data, the shift from manual to automated approaches has become a practical necessity rather than a luxury. Learn more about how a comprehensive Plant Screening System can support this transition in your own research program.
Expert Insight
The most underappreciated advantage of automation is not throughput but measurement timing. Capturing all plants within the same 20-minute biological window each day eliminates the diurnal confound that quietly inflates variability in manual datasets. This single factor can reduce your required replicate count by 25-30% while maintaining equivalent statistical power.
Why Breeding and R&D Teams Invest: The Business Case for Automation
The short answer is decision speed. A breeding team screening 500 lines of Zea mays for drought tolerance needs to identify the top 10% before the next planting window. Manual scoring might deliver final rankings in six weeks. Automated screening, by generating daily transpiration and growth data from the first week of treatment, can flag clear underperformers within 10-14 days.
Niu et al. (2021), in their review of robotic technologies for high-throughput plant phenotyping published in Frontiers in Plant Science, documented that automation reduces per-plant measurement time by 60-80% compared to manual protocols while simultaneously increasing the number of traits captured per cycle. That gain compounds over a multi-week experiment. A team running a 30-day salinity trial on 300 plants, with three measurement cycles per day, accumulates over 27,000 individual datapoints without adding staff hours.
Beyond throughput, automated equipment improves decision confidence. When every measurement follows the same calibrated protocol, treatment differences that would be buried in manual noise become statistically detectable at smaller effect sizes. This means your experiment can resolve a 5% difference in biomass accumulation between two genotypes, where manual scoring might require a 15% difference to achieve the same statistical power. For product efficacy trials, agrochemical dose-response studies, and trait validation work, that sensitivity directly translates into fewer repeat trials and faster go/no-go decisions.
Case Study Spotlight: Breeding Program Acceleration
A commercial maize breeding program transitioned from manual scoring to automated gravimetric and imaging-based screening across a 500-line drought tolerance panel. Results after two seasons: underperformer identification time dropped from 42 days to 12 days, repeat trial frequency fell from 27% to 4%, and the program advanced to field testing one full season earlier than previously scheduled. The cost per screened line decreased by 68% after platform amortization over 36 months.
Based on platform deployment data compiled from research collaborator programs. Specific client details withheld by agreement.
How an Automatic Phenotyping Platform Works End-to-End
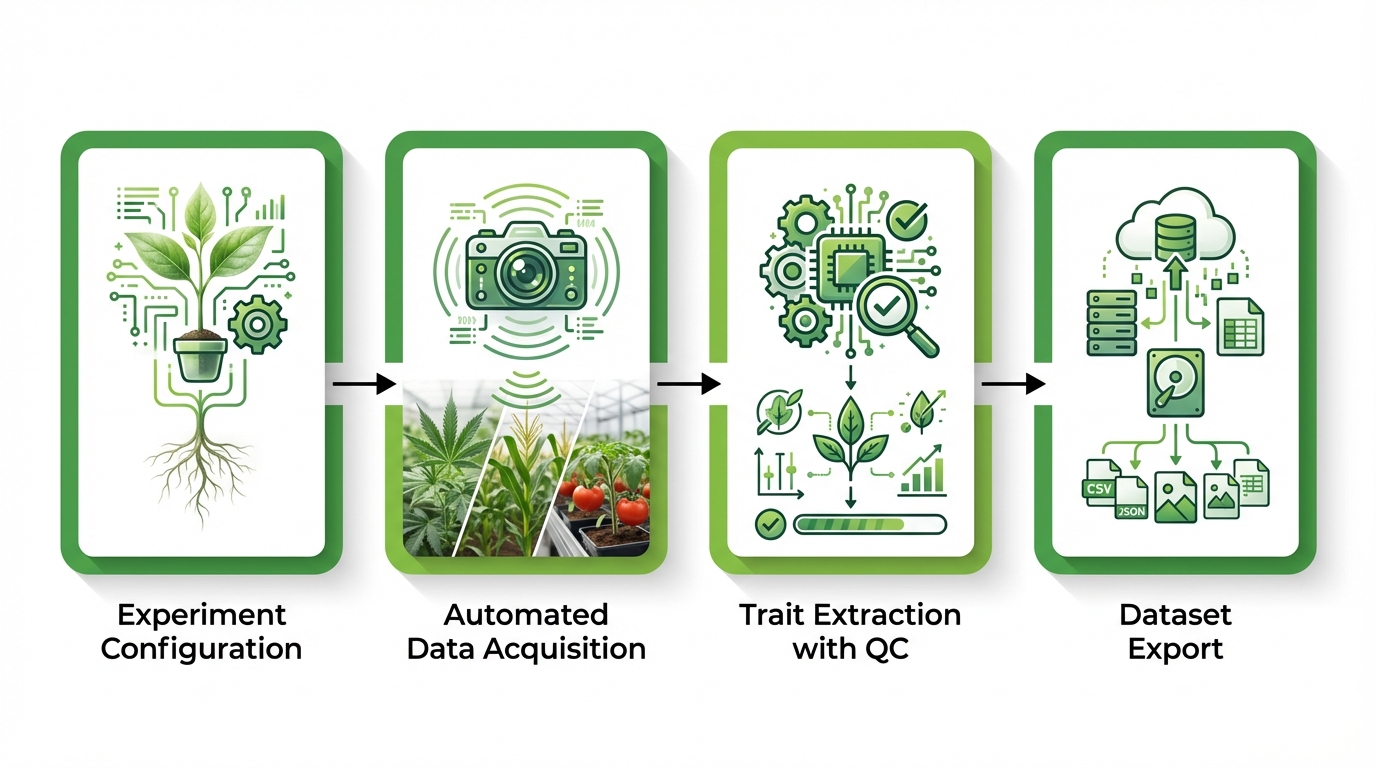
A typical automated phenotyping workflow moves through four distinct phases: experiment configuration, automated data acquisition, trait extraction with quality control, and dataset export for downstream analysis. Each phase depends on the previous one, and weaknesses at any stage propagate through the final results.
Experiment Setup and Metadata Assignment
Before a single measurement occurs, the platform requires a complete experimental map. Every plant receives a unique identifier linked to its genotype, treatment group, replicate number, and physical position. This metadata layer is what transforms raw sensor readings into interpretable biology. A common mistake, particularly in teams transitioning from manual methods, is treating metadata entry as an administrative task rather than an experimental design decision. If your plant IDs do not map cleanly to your statistical model, no amount of sensor precision will rescue the analysis.
Randomization of plant positions within the system is equally critical. Environmental gradients exist in every greenhouse and growth chamber. Proper randomization, recorded in the platform’s metadata, allows you to account for position effects during analysis rather than confounding them with treatment effects.
Common Mistake Warning
Teams that treat plant ID assignment as a data entry formality, rather than a design-critical step, typically discover the error at analysis when genotype-treatment confounding is already locked into the dataset. Prevention requires dual-entry verification at setup and barcode or RFID-based identity confirmation at every measurement cycle.
Automated Measurement Cycles and Time-Series Acquisition
Once the experiment begins, the platform executes measurement cycles at programmed intervals. Depending on system architecture, plants either move to a fixed sensor station on a conveyor or rail system, or mobile sensors traverse rows of stationary plants. Each cycle captures the full sensor stack for every plant: visible imaging, weight measurement, environmental logging, and any additional modalities configured for the experiment.
The value of time-series acquisition becomes apparent when you compare it to endpoint-only measurements. A single destructive harvest tells you that genotype A produced 15% more biomass than genotype B. Continuous automated measurement tells you that genotype A grew faster during the first week, slowed during salt stress onset in week two, and recovered 48 hours after stress relief, while genotype B maintained steady but slower growth throughout. Those dynamics are where biological insight lives. As reviewed by Fahlgren et al. (2015) in their analysis of image-analysis pipelines for high-throughput phenotyping in Frontiers in Plant Science, multimodal time-lapse data capture is what separates screening from mere measurement.
Trait Extraction, QC Flags, and Dataset Export
Raw sensor outputs require processing before they become usable traits. Images become projected leaf area, height, and compactness values. Weight readings become transpiration rates after correcting for irrigation events. The platform’s software applies trait extraction algorithms, flags outliers or missing data with QC codes, and assembles the results into structured, time-stamped datasets. The ability to trace any final trait value back to its raw source data, the specific sensor reading, the calibration state at that moment, and the environmental conditions, is what distinguishes a research-grade platform from a data-collection gadget.
What Traits Can Automated Plant Screening Quantify?
Automated screening captures three broad categories of traits, each measured as continuous time-series rather than isolated snapshots. The table below summarizes the primary trait domains, their typical measurement basis, and the biological questions they address.
Growth and Morphology Traits
RGB and 3D imaging systems track changes in plant structure over time. Daily projected leaf area measurements on a population of 200 Glycine max plants, for example, generate growth curves that reveal differences invisible to weekly manual scoring. A genotype that grows 2.1 cm squared per day under well-watered conditions but drops to 0.8 cm squared per day within 48 hours of water restriction shows a fundamentally different stress strategy than one that declines gradually over seven days. These kinetic differences matter for breeding decisions and are accessible only through automated, high-frequency measurement.
Water Relations and Stress-Response Traits
Gravimetric systems that weigh each plant continuously, correcting for irrigation inputs, produce whole-plant transpiration data at resolutions of minutes to hours. This approach captures the diurnal transpiration curve, the daily rhythm of water loss that reflects stomatal behavior, atmospheric demand, and root water uptake capacity in an integrated signal. Monitoring plant traits related to water relations at this temporal resolution reveals stress responses days before they become visible to the human eye.
Treatment Response Traits
When you apply a defined treatment, such as progressive drought, stepped salinity increases, or agrochemical application, automated time-series data lets you construct response curves for each genotype or treatment group. The onset of response, the magnitude of change, and the speed of recovery after treatment removal each become quantifiable parameters. To be precise, what you are measuring is not a single tolerance score but a multi-dimensional response profile that supports more nuanced selection criteria.
Industry Secret Reveal
Recovery rate after stress relief, the speed at which a plant resumes normal transpiration and growth following drought or salinity removal, is among the most predictive traits for field performance under variable rainfall conditions. Yet it is almost never measured in manual screening programs because it requires continuous monitoring through the re-watering window. Automated platforms capture it automatically as part of the standard time-series record, giving your selection criteria a dimension most competitors are not evaluating.
Which Sensors Matter for Your Specific Research Goals?
Sensor selection should be driven by your target traits, not by the desire to collect the widest possible data. Every sensor added to the stack increases measurement cycle time, data volume, and analytical complexity. The right approach matches modalities to questions.
RGB and 3D Imaging for Structure and Growth
Standard visible-light cameras remain the workhorse of automated phenotyping. Multi-view RGB imaging, where three to five cameras capture each plant from different angles, generates projected area, height, width, and color-based indices. Stereo or structured-light 3D systems add volume estimation and architectural detail. For most growth and morphology questions, RGB imaging provides sufficient resolution at high throughput.
Thermal Imaging for Temperature-Based Stress Proxies
Leaf surface temperature correlates with transpiration rate: a plant with open stomata cools through evaporative water loss, while a stressed plant with closed stomata heats up. Thermal cameras capture canopy temperature maps that can detect stomatal closure before wilting becomes visible. A 1.5 degree Celsius increase in canopy temperature relative to well-watered controls, for instance, often precedes measurable changes in growth rate by 24-48 hours in species such as Solanum lycopersicum.
Fluorescence Imaging for Photosynthetic Performance
Chlorophyll fluorescence imaging measures the efficiency of photosystem II, providing a direct readout of photosynthetic health. Parameters such as Fv/Fm (maximum quantum yield) and non-photochemical quenching indicate how effectively a plant converts light energy and how it manages excess energy under stress. This modality is particularly valuable for herbicide mode-of-action studies and for screening photosynthetic efficiency across genotype panels.
Hyperspectral and NIR Options for Biochemical Signals
Hyperspectral sensors capture reflectance across hundreds of narrow wavelength bands, enabling estimation of leaf water content, pigment concentrations, and nitrogen status without destructive sampling. As demonstrated by research on automated multi-sensor image registration published in Plant Methods (2024), combining RGB, hyperspectral, and fluorescence data into aligned, co-registered datasets allows trait extraction that no single modality could achieve alone. The trade-off is measurement time: hyperspectral acquisition per plant may take 30-90 seconds compared to 2-5 seconds for RGB, directly affecting daily throughput.
Expert Tip
Before specifying your sensor stack, map every intended research question to a specific trait, that trait to its required measurement modality, and that modality to its per-plant acquisition time. Then calculate your total daily measurement window against your plant population size. This exercise prevents the common error of specifying a sensor configuration that physically cannot complete a full measurement cycle within your available daily window.
Phenotyping vs. Screening: The Distinction That Changes Your Platform Choice
Researchers sometimes use “phenotyping” and “screening” interchangeably, but the operational difference is significant. Phenotyping is the measurement of traits. Screening is the application of those measurements to rank, classify, or select individuals from a population against defined criteria. A phenotyping experiment might characterize how 20 genotypes respond to salt stress in fine physiological detail. A screening program might evaluate 2,000 genotypes under the same stress and select the top 50 for field advancement.
The distinction affects platform requirements. Phenotyping emphasizes measurement depth: more sensors, higher temporal resolution, smaller populations. Screening emphasizes throughput: faster cycle times, simpler sensor stacks, larger populations with sufficient statistical power. Most research programs need both capabilities at different stages, and the best platform decisions account for this by evaluating whether a system can operate in high-throughput screening mode for large populations and switch to deep-phenotyping mode for detailed follow-up studies on selected lines.
How Automated Platforms Deliver Research-Grade Reproducibility
Reproducibility fails in manual phenotyping for predictable reasons: different operators apply slightly different scoring criteria, measurements happen at inconsistent times of day, environmental conditions are logged sporadically or not at all, and protocols drift over the course of a multi-week experiment. Automated platforms address each of these failure modes systematically.
Measurement timing is fixed by the scheduling algorithm. Sensor calibration follows manufacturer-defined routines at programmed intervals. Environmental conditions, including temperature, humidity, light intensity, and CO2 concentration, are logged continuously and associated with every measurement record. According to NIST guidelines on metrological traceability, measurement systems that maintain documented calibration chains and uncertainty budgets produce data that can be compared across laboratories and time periods. Automated phenotyping platforms that implement these principles give your published results a defensibility that manual data collection cannot match.
One practical test of reproducibility: run the same 20-plant experiment twice on consecutive weeks under identical conditions. If your platform produces trait rankings that correlate at r greater than 0.90 between runs, the system is performing at research grade. Any colleague who has attempted this with manual scoring knows how difficult that threshold is to achieve without automation.
Expert Methodology: The Reproducibility Protocol
Based on the deployment methodology developed across our platform installations worldwide, the following four-step reproducibility verification protocol should be completed before any experiment dataset is accepted for publication or advancement decisions:
- Run duplicate 20-plant calibration panels at experiment start and end, targeting r greater than 0.90 Pearson correlation for primary traits.
- Verify sensor calibration state against reference standards at 7-day intervals throughout each experiment.
- Calculate coefficient of variation for control plants at each measurement cycle. Flag any cycle where CV exceeds 1.5 times the baseline CV from the first three days.
- Document all environmental deviations exceeding defined thresholds in experiment metadata and account for them in the statistical model.
What to Evaluate When Selecting Plant Screening Equipment
Purchasing decisions often focus on sensor specifications, but operational factors determine whether a platform delivers value over its 5-10 year operational life. The checklist below organizes evaluation criteria by category.
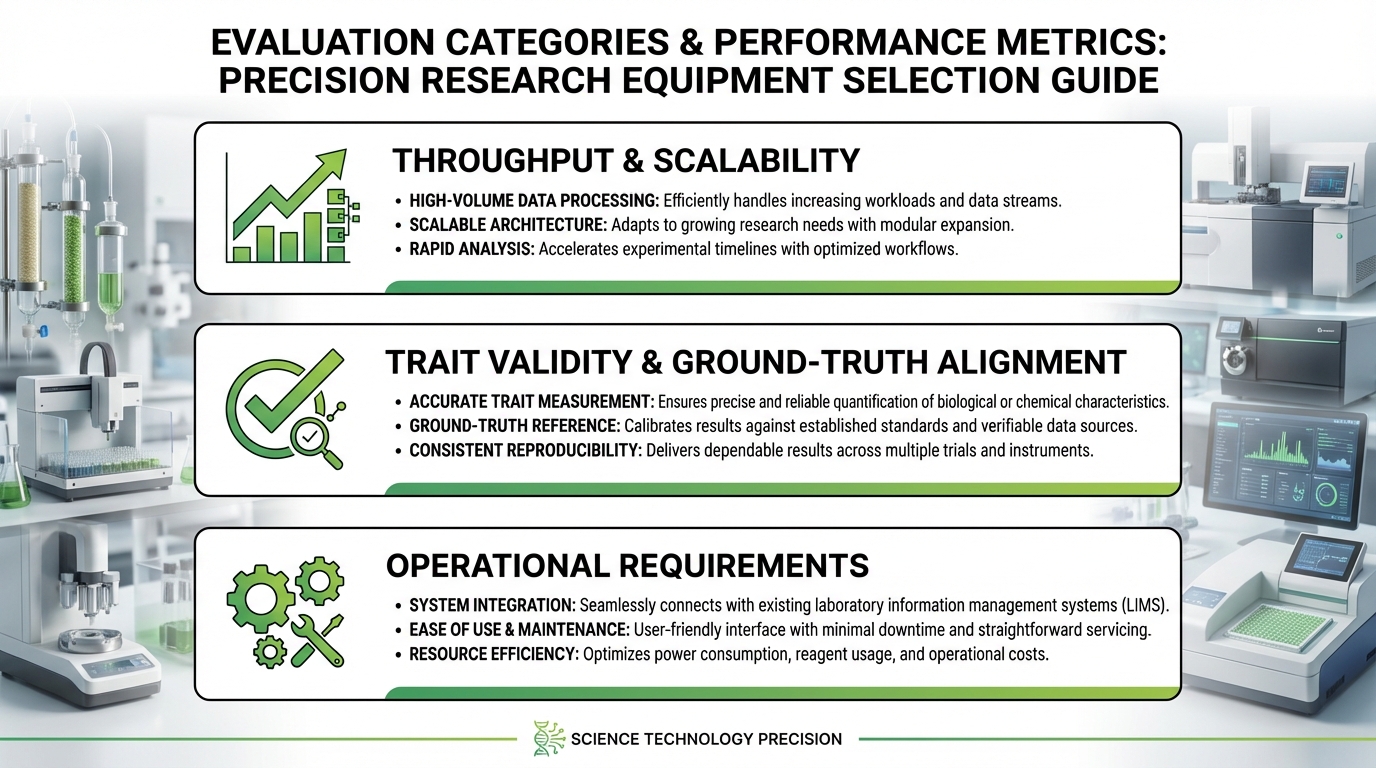
Throughput and Scalability
Define your throughput requirement in concrete terms: how many plants per day, at what measurement frequency, capturing which traits. Then ask whether the system can scale. If your current pipeline screens 400 plants per experiment but your breeding program plans to double within three years, a platform operating at 90% capacity today becomes a bottleneck tomorrow. Evaluate both current capacity and the upgrade path for sensors, conveyor speed, and software licensing.
Trait Validity and Ground-Truth Alignment
Request validation data that compares platform-derived traits to established reference methods. If the system reports leaf area, how closely does its estimate correlate with destructive leaf area meter measurements? If it reports transpiration, has it been validated against lysimetric or porometer data? A platform that produces numbers without demonstrated ground-truth alignment is generating data of unknown biological meaning. This is a disqualifying issue for any serious research application.
Operational Requirements
Physical footprint, power consumption, compressed air requirements, network infrastructure, climate control demands, and staff training hours all contribute to total cost of ownership. A platform that requires a dedicated full-time operator costs differently than one that runs unattended overnight. Document these requirements during evaluation and compare them against your facility’s actual capabilities.
Expert Evaluation Checklist
- Has the vendor provided peer-reviewed or independently verified trait validation data?
- Can you inspect an actual exported dataset from a completed experiment before purchase?
- Is there a documented calibration schedule with acceptable drift thresholds specified?
- Does the software maintain a complete audit trail linking every trait value to its source sensor reading and calibration state?
- What is the vendor’s mean time to repair for critical hardware failures, and do they stock spare parts locally?
- Does the platform export data in formats compatible with your existing analysis tools and breeding management system?
Balancing Throughput Against Data Quality: The Expert Framework
The temptation in high-throughput screening is to maximize plants per day. But throughput without quality control produces large datasets of questionable value. The practical approach is to establish quality thresholds first, then optimize throughput within those constraints.
Run a pilot study at your target throughput speed. Measure the coefficient of variation for your primary trait across replicate plants. If CV exceeds your acceptable threshold, typically 5-8% for morphological traits and 10-15% for physiological traits, identify the source. Common culprits include insufficient sensor warm-up time between measurements, plant movement during imaging caused by conveyor vibration, and inadequate ambient light control. Each of these has engineering solutions, but you need the pilot data to diagnose them.
Track the missing-data rate as well. If 3% of measurements fail QC in a pilot run, that may be acceptable. If the rate climbs to 12% at higher conveyor speeds, you are trading throughput for statistical power. The calculation is straightforward: losing 12% of data points across a 30-day experiment on 500 plants means approximately 1,800 missing values, and if those failures cluster by time of day or position, the bias is worse than the count suggests.
Ready to see these principles applied to your specific research pipeline?
Our team of plant physiologists and phenotyping engineers can walk you through a live platform demonstration tailored to your target species, trait objectives, and experimental scale.
Automated Irrigation and Weighing: The Underutilized Competitive Advantage
Weight-based monitoring is among the most informative and underutilized capabilities in automated plant screening. A system that weighs each plant at every measurement cycle, and that controls irrigation delivery to each individual pot, generates a continuous water balance for every plant in the experiment.
Consider a drought screening trial on 300 Oryza sativa genotypes. Automated systems often include a fully integrated gravimetric system that maintains each pot at a target soil moisture level during the control phase, then imposes a precisely defined dry-down by withholding irrigation. Because every irrigation event and every weight change is recorded, you can calculate daily transpiration for each plant with gram-level precision. The resulting transpiration curves reveal genotype-specific responses to declining soil moisture: some lines reduce transpiration sharply at 60% field capacity, while others maintain near-normal rates down to 35%.
This level of resolution transforms drought screening from a binary survived-versus-wilted endpoint into a continuous physiological profile. Selection criteria can then incorporate the soil moisture threshold for stomatal closure, the rate of transpiration decline, and the speed of recovery after re-watering, each of which has different agronomic implications depending on your target environment.
Case Study Spotlight: Rice Drought Screening at Scale
A national rice breeding program used gravimetric automated screening to evaluate 300 Oryza sativa genotypes under controlled progressive drought over 21 days. Gravimetric transpiration data identified 38 genotypes showing stomatal closure delay beyond 40% field capacity. Of those 38, 31 (82%) validated as superior-performing lines in subsequent multi-location field trials, compared to a 44% validation rate for lines selected by manual visual scoring in the prior season. The automated data reduced field validation costs by an estimated 37% per season by improving the precision of greenhouse-to-field advancement decisions.
Data Outputs That Distinguish Research-Grade Platforms
Raw data alone is insufficient. A research-grade automatic phenotyping platform delivers structured outputs at four levels: raw sensor data with full provenance, extracted traits with documented algorithms, QC flags and logs that explain every excluded or modified datapoint, and experiment-level metadata that enables complete reproducibility.
Time-stamped datasets should link every trait value to its source measurement, the plant’s identity and treatment assignment, and the environmental conditions at the moment of capture. Wilkinson et al. (2016), writing in Scientific Data, established the FAIR principles (Findable, Accessible, Interoperable, Reusable) as the standard for scientific data stewardship. Phenotyping data that adheres to these principles, with persistent identifiers, rich metadata, and standardized formats, integrates cleanly into breeding databases, statistical analysis pipelines, and multi-site comparison studies.
Ask any prospective platform vendor to show you an actual exported dataset from a completed experiment. Examine whether plant IDs are consistent across timepoints, whether environmental data is co-located with trait data, whether QC codes are documented, and whether the export format is compatible with your existing analysis tools, whether that is R, Python, or a commercial breeding management system.
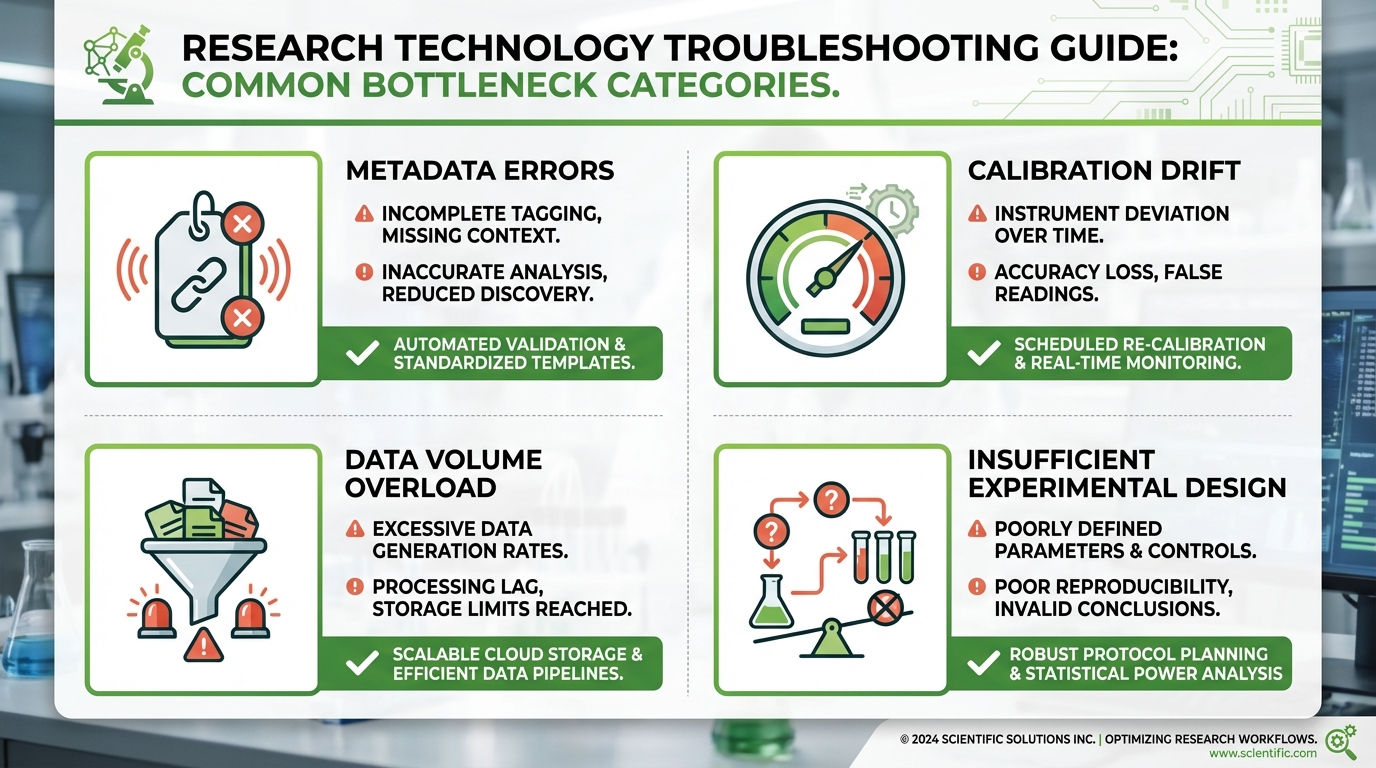
The Most Common Bottlenecks in High-Throughput Screening Projects
Hardware failures get the most attention, but operational bottlenecks cause more cumulative downtime and data loss. Based on challenges documented across phenotyping facilities worldwide, including those reviewed in USDA-NIFA resources on field-based high-throughput phenotyping and data management, the most persistent problems fall into four categories.
Metadata errors rank first. A misassigned genotype label at planting invalidates every measurement on that plant for the entire experiment. Prevention requires double-entry verification at setup and barcode or RFID-based plant identification during measurement. Calibration drift ranks second. Sensors that were accurate on day one may shift by day 21. Platforms that schedule automatic calibration checks and flag drift exceeding defined thresholds catch this before it corrupts your results.
Third, data volume overwhelms analysis pipelines. An experiment generating 2 GB of image data per day produces 60 GB over a month. Without automated trait extraction running in near-real-time, raw data accumulates faster than your team can process it, delaying decisions and creating a backlog that persists into the next experiment cycle. Fourth, insufficient experimental design, too few replicates, inadequate controls, or timepoints that miss the biological window of interest, produces datasets that are technically complete but statistically underpowered for the questions being asked.
Field Observation
From our experience reviewing datasets across dozens of phenotyping facility deployments: the single most damaging bottleneck is not hardware, software, or throughput, it is the gap between data generation and data review. Facilities that review QC flags and calibration logs daily, during the experiment, catch problems while they are recoverable. Facilities that review data after the experiment ends discover problems that cannot be corrected. Build daily data review into your experimental protocol as a non-negotiable step.
How to Design Experiments for Automated Platforms
Experimental design for automated platforms follows the same statistical principles as any controlled study, with added considerations specific to time-series data and platform logistics. Start with your primary comparison: genotypes, treatments, or their interaction. Define the minimum detectable difference that matters biologically. From that, calculate the required number of replicates using power analysis based on expected trait variability.
Randomization must account for spatial gradients within the platform. If your system uses a linear conveyor, plants at opposite ends may experience slightly different light or temperature conditions. A randomized complete block design, with blocks corresponding to physical zones of the platform, addresses this directly. Include well-watered controls at a density of at least 10-15% of total plant positions. These controls serve as the reference baseline for calculating treatment effects and for detecting system-level drift over time.
Timing deserves particular attention. If your species shows peak transpiration between 10:00 and 14:00, ensure that measurement cycles capture that window consistently for all plants. A measurement schedule that scans the first 100 plants during peak transpiration and the last 100 plants after 16:00 introduces a systematic time-of-day confound. Adjust cycle scheduling so that all plants are measured within the same biological window, or randomize measurement order across days to distribute the effect evenly.
ROI of Automated Screening: The Four Metrics That Matter
Return on investment in automated screening is best evaluated through four metrics. Cost per data point compares the fully loaded cost of generating one trait measurement manually versus automatically. For a facility screening 1,000 plants across a 28-day trial with daily measurements, the automated cost per data point is typically 70-85% lower than manual equivalents once the system is operational.
Time-to-decision measures how quickly screening data translates into advancement or elimination choices. If automated screening identifies underperformers 14 days earlier than manual methods, and that enables one additional screening cycle per season, the pipeline throughput increase often justifies the platform investment within two to three seasons. Cost per screened line tracks the total expense of evaluating one genotype through a complete screening cycle. Early failure detection, removing poor performers after 10 days instead of carrying them through a full 30-day trial, reduces this cost by freeing platform capacity for additional lines.
Reduction in repeat trials captures an often-overlooked benefit. When data quality is high enough to make confident decisions from a single experiment, the frequency of “we need to run that again” drops substantially. Programs that previously repeated 20-30% of trials due to ambiguous manual results often see that rate fall below 5% with automated data capture.
How to Validate a System Before Full-Scale Deployment
Validation is the step that separates informed purchasing from expensive guessing. A structured validation protocol should test four properties: repeatability, sensitivity, stability, and ecological validity.
Repeatability testing places the same set of plants (or calibration objects) through the measurement cycle multiple times within a single day. If the system reports leaf area of 42.3 cm squared on the first pass and 44.1 cm squared on the second pass for the same plant, that 4.3% discrepancy sets a floor on your measurement uncertainty. Sensitivity testing determines whether the platform can detect known biological differences. Use genotypes with documented trait contrasts, such as a drought-tolerant and drought-susceptible pair of Sorghum bicolor lines, and verify that the automated measurements resolve the expected differences at the expected timepoints.
Stability testing extends repeatability over weeks. Measure a set of calibration references at the start and end of a 30-day period. Drift exceeding your acceptable threshold indicates a need for more frequent calibration or hardware adjustment. Research initiatives such as the USDA-NIFA project on advancing plant phenotyping from greenhouse to field plots emphasize that validation must span the range of environments where the system will operate, because sensor performance in a climate-controlled growth chamber may differ from performance in a semi-controlled greenhouse with variable light.
Ecological validity asks whether platform-derived trait rankings predict field performance. This requires multi-season comparison data and is the most demanding validation test, but it is the one that ultimately determines whether your screening program is identifying genuinely superior genotypes or selecting for artifacts of the controlled environment.
Peer Endorsement
“The shift from visual scoring to gravimetric time-series data fundamentally changed the quality of our selection decisions. We were no longer choosing between plants that looked similar at a single endpoint. We were choosing between plants with quantifiably different physiological strategies across a three-week stress period. That biological depth is not achievable any other way.”
Senior Plant Physiologist, International Cereal Breeding Program (identity withheld per standard collaboration agreement). Based on platform deployment data from a wheat drought tolerance screening program spanning three seasons.
Peer Endorsement
“What convinced us was the validation dataset. Seeing the correlation between platform-derived transpiration efficiency rankings and our own independently collected porometer measurements at r equals 0.94 across 60 genotypes gave us confidence to base advancement decisions on automated data alone. That confidence was not possible with manual methods.”
Principal Investigator, Abiotic Stress Research Laboratory, European Research University (identity withheld per standard collaboration agreement). Based on gravimetric platform validation study, published results on file.
Applying Automated Screening to Your Research Program
Automated plant screening compresses the timeline between asking a biological question and obtaining a statistically defensible answer. The core value is not measurement speed alone, but the combination of throughput, consistency, and temporal resolution that reveals plant behavior invisible to manual observation. The technologies described here, from gravimetric water-use monitoring to multi-modal sensor integration, represent tools that research teams in over 20 countries are currently using to accelerate breeding decisions, validate agronomic products, and advance fundamental understanding of plant physiology.
For research teams evaluating automated screening for drought tolerance, salinity response, biostimulant efficacy, or genotype-by-environment studies, the choice of platform will shape the quality of your data for years. Plant-Ditech’s systems, developed from over a decade of collaboration between plant physiologists and engineers, are designed to deliver the trait validity and data integrity that rigorous research demands. To discuss how a specific system configuration might fit your experimental needs, contact our team at +972-8-699-9169, visit our contact page, or Book a Demo to see the platform in operation with your target species and traits.
Advanced FAQ: Questions Only Expert Practitioners Ask
Expert Recommendation
The Right Platform Decision Starts With the Right Conversation
From our experience deploying automated phenotyping platforms across research programs on four continents, the programs that achieve the highest return on their platform investment are those that begin with a detailed technical consultation, not a product demonstration. Understanding your specific species, trait targets, throughput requirements, and existing data infrastructure before selecting a configuration ensures that your platform is built for your science, not around a sales catalog. Contact our team to begin that conversation.
Plant-Ditech Ltd. | +972-8-699-9169 | 15+ years of phenotyping platform expertise | Serving research programs in 20+ countries