
Commercial Plant Salinity Stress Phenotyping Solutions from Plant-Ditech
With over 10 years of practical experience in plant stress physiology and having supported dozens of salinity-focused studies across 20+ countries, our methodology has helped institutions improve salinity tolerance screening. Soil salinity currently affects approximately 20% of cultivated land and 33% of irrigated agricultural land worldwide, with an estimated 10% annual increase in affected areas — making reliable phenotyping tools more critical than ever. This comprehensive guide distills peer-reviewed insights and field-tested protocols into actionable steps that deliver reproducible, publication-ready results. [Hailegnaw et al., 2025]
Studies Supported
Countries
Years of Expertise
Phenotyping Methods
Exclusive Insight from Our Research Team:
The strongest differentiation between sensitive and tolerant genotypes often appears during early-to-mid stress progression — a window that varies by crop, trait, and stress intensity. Researchers who rely only on endpoint assessments can miss important response dynamics that are only visible in continuous time-series measurements.
What Is Plant Salinity Stress Phenotyping?
Plant salinity stress phenotyping is the quantitative measurement of plant performance under salt stress using standardized traits to compare genotypes, treatments, or interventions. Unlike simple visual assessments, phenotyping generates numerical data on growth dynamics, physiological status, and stress symptom progression that can be statistically analyzed and reproduced across experiments. The approach integrates non-destructive imaging technologies (RGB, fluorescence, hyperspectral), biomass proxies, and physiological indices to create comprehensive profiles of how individual plants or populations respond to saline conditions. These measurements enable researchers to rank tolerance objectively, identify mechanisms underlying stress responses, and accelerate selection cycles in breeding programs.
Expert Insight
From our experience supporting salinity-focused studies, teams that implement quantitative phenotyping protocols typically make faster and more confident selection decisions than teams relying only on visual scoring.
Why Do Researchers and Breeders Need Salinity Stress Phenotyping Instead of Visual Scoring?
Visual scoring relies on human judgment to assign categorical ratings based on observable symptoms, introducing subjectivity and limiting resolution. Two observers may score the same plant differently, and subtle early-stage stress responses often escape detection entirely. Physiology phenotyping addresses these limitations by providing repeatable, time-series data that captures early stress signals before visible damage appears. Early shifts in leaf color indices or chlorophyll fluorescence parameters can indicate stress onset days before biomass loss becomes evident, enabling intervention or selection decisions at optimal timing. The quantitative nature of phenotyping data also supports sophisticated statistical analysis, multi-environment comparisons, and integration with genomic or molecular datasets.
Common Mistake
Many research teams underestimate inter-observer variability in visual scoring. Published and internal comparisons show that scorer disagreement can be substantial, especially across large screening populations and multiple evaluation timepoints.
How Does Salt Tolerance Screening Differ from Salinity Phenotyping?
Salt tolerance screening and salinity phenotyping serve complementary but distinct purposes in plant research. Phenotyping is the measurement system that generates trait data—growth curves, stress indices, physiological parameters collected over time. Screening is the decision framework that uses phenotyping outputs to classify and rank lines according to their tolerance. Screening outputs include thresholds, rankings, and selection decisions that determine which genotypes advance to the next evaluation stage. Phenotyping outputs include raw trait values, derived indices, and time-series curves that describe how plants responded to imposed conditions. Understanding this distinction helps teams design experiments that generate data appropriate for their specific decision needs.
What Are the Two Phases of Salinity Stress and Why Do They Matter for Phenotyping?
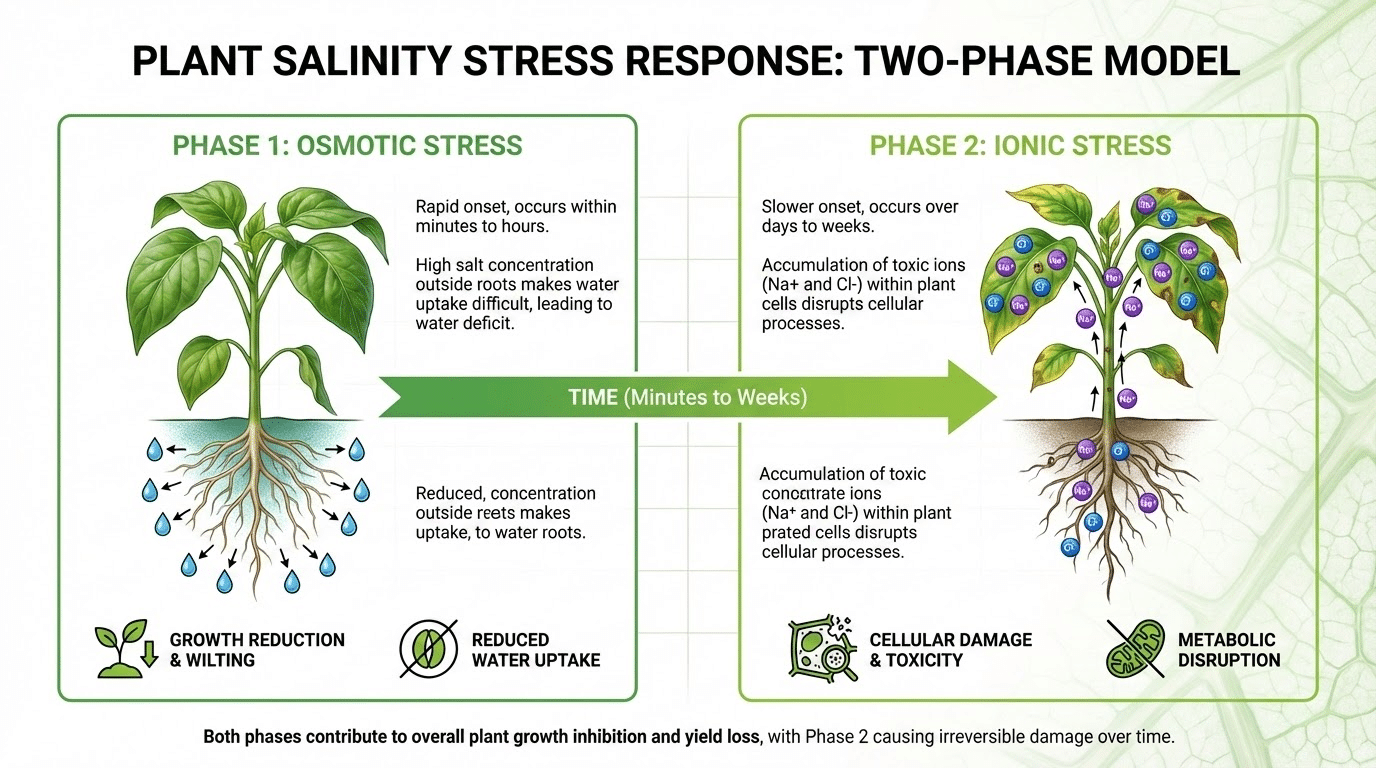
Plants exhibit a characteristic two-phase response to salinity that profoundly influences phenotyping strategy. The osmotic phase begins immediately upon salt exposure, causing rapid growth reduction similar to water deficit as the external salt concentration lowers soil water potential. According to foundational research published in the Annual Review of Plant Biology (Munns & Tester, 2008) and earlier comparative work by Munns (2002), this phase affects all plants regardless of their ultimate tolerance classification. The ionic phase develops more slowly as toxic ions (primarily Na+ and Cl-) accumulate in tissues, causing cellular damage, premature senescence, and eventual death of sensitive genotypes. This two-phase model means early phenotyping should focus on growth rate maintenance and stomatal-related proxies, while later measurements emphasize senescence progression, photosynthetic integrity, and ion-related damage indicators.
Which Scenario Requires Early-Phase Versus Late-Phase Phenotyping?
Choosing between early and late phenotyping windows depends on your experimental objectives and target traits. Early-phase phenotyping (first hours to days after stress imposition) captures osmotic adjustment capacity, stomatal regulation speed, and initial growth rate responses. This window suits researchers investigating rapid signaling mechanisms or screening for osmotic tolerance components. Late-phase phenotyping (weeks after sustained stress) reveals ion toxicity effects, tissue tolerance mechanisms, and long-term survival differences. Breeding programs targeting field performance often prioritize late-phase traits because ion accumulation typically determines yield outcomes in saline environments. Many comprehensive studies combine both windows, using early measurements to detect rapid responders and later assessments to confirm sustained tolerance.
Which Plant Traits Are Most Informative for Salinity Tolerance Screening?
The most informative traits for salt tolerance screening combine growth maintenance, photosynthetic integrity, and stress symptom progression measured across multiple timepoints. Projected leaf area and relative growth rate provide direct indicators of vigor under stress. Color-based indices quantify chlorosis and necrosis progression objectively. Chlorophyll fluorescence parameters reveal photosynthetic efficiency and stress-induced damage to photosystem components. Water-use related proxies help assess stomatal behavior and hydraulic responses. Survival and recovery measurements distinguish truly tolerant lines from those that simply decline slowly. The optimal trait combination depends on crop species, target environment, and selection objectives, but time-series measurements consistently outperform single-timepoint assessments.
How Do You Choose Between Seedling, Vegetative, and Reproductive-Stage Salinity Phenotyping?
Stage selection should match your target product profile and the growth phase where selection decisions carry greatest impact. Seedling screens offer high throughput and rapid turnaround, enabling evaluation of thousands of lines in controlled conditions. However, seedling tolerance may not predict adult plant performance or yield under field salinity. Vegetative-stage phenotyping balances throughput with physiological relevance, capturing responses after plants establish root systems and develop characteristic architectures. Reproductive-stage assays provide the strongest yield-relevance signals but require longer experiments, more resources, and careful management of confounding factors. Many programs use seedling screens for initial population reduction, then advance promising selections to later-stage validation.
Should You Use Sudden Salt Shock or Gradual Ramping for Stress Imposition?
The method of salt stress imposition significantly affects experimental outcomes and interpretation. Gradual ramping—incrementally increasing salt concentration over days—generally improves reproducibility by allowing plants to initiate adaptive responses before experiencing maximum stress intensity. This approach helps separate true tolerance mechanisms from acute injury responses and better mimics field conditions where soil salinity often increases progressively. Research in the Journal of Experimental Botany demonstrates that ramping protocols reduce confounding injury effects. Sudden shock application can reveal membrane stability differences and rapid signaling responses, making it appropriate for specific mechanistic studies. Document your imposition method precisely, as results from shock and ramping protocols may not be directly comparable.
What Salt Source and Concentration Should Be Used for Salinity Stress Experiments?
Salt source and concentration choices should create measurable separation among genotypes without collapsing the entire population into uniform failure. NaCl remains the most common salt source due to its dominance in many saline environments and straightforward handling. However, mixed-salt solutions containing Na+, Cl-, Ca2+, Mg2+, and SO42- may better represent field conditions in specific target regions. Concentration selection depends on species sensitivity, experimental duration, and screening objectives. Species-specific tolerance thresholds vary enormously — a useful reference framework is provided by Shannon & Grieve (1999), who compiled salinity tolerance thresholds across vegetable crops. In a 2025 study using the PlantArray system, Hailegnaw et al. identified a critical EC threshold of 6 dS/m in papaya, above which transpiration declined significantly — illustrating how a well-calibrated concentration range enables meaningful genotype separation. Documenting electrical conductivity (EC) values rather than relying solely on molar concentrations improves comparability across experimental setups and substrate types. The FAO guidelines on water quality for agriculture provide standardized frameworks for EC measurement and interpretation.
What Are Common Mistakes When Selecting Experimental Salt Concentrations?
One frequent error involves choosing concentrations based on literature values without considering species-specific sensitivity or substrate effects. A concentration that creates good genotype separation in hydroponics may cause uniform death in soil-based systems due to matric potential interactions. Another mistake is testing only a single concentration, which may fall outside the optimal discrimination range for the population being evaluated. Pilot experiments with a concentration gradient help identify the range where genotype differences manifest clearly. Failing to monitor and document EC throughout the experiment introduces hidden variability, as salt concentration in root zones can change due to evaporation, plant uptake, or leaching depending on the system design.
Why Concentration Selection Is Critical — Evidence from Published Research
Hailegnaw et al. (2025) demonstrated this risk directly: in papaya, EC at 8 dS/m caused a 53% collapse in cumulative transpiration — well above the identified discrimination threshold of 6 dS/m. A researcher applying that same concentration to a more sensitive species would likely see uniform plant failure across all genotypes, producing no useful ranking data. At 2 dS/m, by contrast, the decline was only 2% — too subtle to separate tolerant from sensitive lines. This illustrates why a pilot concentration gradient is not optional: the difference between a concentration that discriminates and one that either kills everything or shows nothing can be as narrow as 2–4 dS/m. Species-specific tolerance thresholds compiled by Shannon & Grieve (1999) confirm that this window varies dramatically across crops.
How Long Should a Salinity Phenotyping Experiment Run?
Experiment duration should capture both early response dynamics and later symptom development, which typically requires multiple imaging or measurement timepoints rather than a single endpoint assessment. As highlighted in research published in the Journal of Experimental Botany, time-series data enables growth-rate modeling and earlier genotype discrimination compared to endpoint-only approaches. The optimal duration depends on species, stress intensity, and target traits. Seedling experiments may require only one to two weeks, while vegetative or reproductive assessments may extend for several weeks. Design experiments with sufficient duration to observe the transition from osmotic to ionic phase effects, and include post-stress recovery periods if resilience assessment is relevant to selection objectives.
What Is the Ideal Experimental Design for Salt Tolerance Screening?
Robust experimental design forms the foundation of meaningful phenotyping outcomes. Essential elements include adequate biological replicates (typically six to twelve per genotype-treatment combination), randomized spatial arrangement to distribute position effects, and appropriate blocking when environmental gradients exist within the growing area. Controls should include non-saline reference treatments for each genotype, plus reference genotypes of known tolerance (both tolerant and sensitive checks) included across all experimental blocks. Consistent pot size, substrate composition, and initial plant size reduce baseline variability that can obscure treatment effects. Pre-register your experimental design and analysis plan to prevent post-hoc adjustments that compromise statistical validity.
How Do You Control Confounders Like Evaporation and Edge Effects?
Confounding factors can introduce false genotype effects that compromise screening accuracy. Standardize containers and substrate across all positions, and manage watering with quantified precision (gravimetric or volumetric control) rather than subjective judgment. Edge plants often experience different vapor pressure deficit and light intensity than interior positions, leading to systematic performance differences unrelated to genotype. Rotation protocols, where plants physically move through positions during the experiment, help distribute these effects randomly. Monitor microclimate variables (temperature, humidity, light) at multiple locations within the growing space to identify gradients that may require blocking or position adjustment in the analysis.
Expert Methodology: The 4-Zone Randomization Protocol
Based on recurring edge-effect patterns observed in controlled-environment experiments, we developed a systematic approach:
- Zone 1 (Perimeter): Border plants excluded from analysis—serves as environmental buffer
- Zone 2 (Outer ring): Reference genotypes positioned here to calibrate edge effects
- Zone 3 (Middle ring): Full randomization of experimental genotypes
- Zone 4 (Center): Replicated check varieties for within-experiment QC
What Is High-Throughput Phenotyping in Saline Stress Plant Research?
High-throughput phenotyping (HTP) refers to automated or semi-automated measurement systems that generate comparable trait datasets at scale across many plants. HTP platforms range from conveyor-based systems that move plants through imaging stations, to gantry systems that move sensors above stationary plants, to sophisticated systems that scan the entire plant at the physiological level and lead to early identification of the plant’s response to the environment. According to a methodological study in Plant Methods, the main features that differentiate HTP from conventional phenotyping include full automation of the procedure and reduction of manual labor, and a faster measurement and analysis method that ensures repeatability over large numbers of samples. As reviewed by Fahlgren et al. (2015) in Current Opinion in Plant Biology, the field of HTP has matured to the point where it is ready for widespread deployment in crop improvement programs. HTP enables screening of hundreds or thousands of genotypes with sufficient replication to support statistical analysis—scale that would be impractical with manual measurements.
How Does Automated Phenotyping Reduce Experimental Variability?
Automation removes human decision points that introduce variability in conventional phenotyping. Platforms like the PlantArray system from Plant-Ditech exemplify this approach by integrating continuous gravimetric monitoring with environmental control, generating time-series physiological data without manual intervention — as demonstrated in a peer-reviewed study by Hailegnaw et al. (2025), who used the PlantArray to continuously track transpiration under four EC levels in papaya, capturing the full time course of salinity-induced decline. The resulting datasets support more sensitive statistical detection of treatment effects and genotype differences because within-experiment noise is minimized. Standardized workflows also facilitate cross-experiment comparisons when protocols remain consistent.
Published Case Study: Automated Transpiration Monitoring Under Salinity
Hailegnaw et al. (2025) — Modeling Earth Systems and Environment · DOI: 10.1007/s40808-025-02343-w
Challenge: Researchers at the University of Florida needed to quantify how different irrigation water salinity levels affect whole-plant transpiration in papaya (Carica papaya L.), and to build machine learning models capable of predicting transpiration under saline field conditions.
Approach: The PlantArray automated phenotyping platform (Plant-Ditech Ltd.) continuously monitored whole-plant transpiration across four EC irrigation treatments (~0, 2, 4, and 8 dS/m) in a controlled greenhouse over a 10-week period. Five machine learning models — including XGBoost, Random Forest, and LightGBM — were trained with and without salinity as an input variable, using 22,363 logged data points.
Results: Salinity effects on transpiration became measurable at 16 days after treatment initiation. The highest EC level (8 dS/m) reduced cumulative transpiration by 53% versus controls; 4 dS/m caused a 14% decline. Including salinity as a model input improved R² by up to 19% and reduced prediction error by up to 25%, with salinity contributing up to 32% of predictive power. A critical EC threshold of 6 dS/m was identified above which transpiration declined significantly — a finding directly applicable to concentration selection in salinity phenotyping protocols.
How Do You Quantify Growth Maintenance Under Salinity Stress?
Growth maintenance refers to a genotype’s ability to continue expanding despite salt stress, a key component of tolerance. Quantification requires comparing stressed plant performance to appropriate controls, typically expressed as stress/control ratios or stress tolerance indices. Relative growth rate (RGR) calculated from time-series biomass proxies captures expansion dynamics more meaningfully than absolute size, which confounds tolerance with inherent vigor differences. Compare slopes of growth curves between treatments to identify genotypes that maintain expansion rates closest to control conditions. Normalize measurements to account for baseline vigor differences among genotypes—a large plant that stops growing may score worse than a small plant maintaining steady expansion.
How Do You Measure Senescence and Leaf Damage Objectively?
Objective senescence and damage quantification relies on image analysis rather than visual scoring. Color-based segmentation separates healthy (green) tissue from chlorotic (yellow) and necrotic (brown) areas, calculating each fraction as a proportion of total visible plant area. Tracking these fractions over time reveals damage progression rates and onset timing—both strong discriminating signals for salt tolerance screening. Advanced algorithms can detect subtle color shifts that precede obvious yellowing, providing earlier stress indicators. Necrosis onset timing distinguishes genotypes that delay damage (tolerance mechanisms effective) from those showing rapid symptom development. Recovery dynamics after stress removal add another discrimination dimension, separating truly tolerant lines from those merely slow to show damage.
Which Root Traits Matter for Salt Tolerance Screening?
Root system characteristics influence water uptake capacity and ion management, both critical for salt tolerance. Important root traits include total root length, lateral root density, root/shoot ratio changes under stress, and root system depth distribution. Phenotyping approaches depend on throughput requirements: hydroponic systems with clear solution or gel media allow non-destructive imaging of root development, while soil-based systems typically require destructive harvest for root assessment. Rhizotrons (transparent-sided containers) offer a compromise, enabling repeated observation of roots growing against visible surfaces.
What Hydroponic Root Phenotyping Can Measure Reliably
Hydroponic systems support high-resolution imaging of root architecture development over time. Measurable traits include primary root length, lateral root number and spacing, root hair density in magnified views, and overall root system geometry. These systems control salt exposure precisely and eliminate soil heterogeneity confounders. However, hydroponic root architecture may not fully predict soil-grown root performance, and the absence of mechanical impedance alters development patterns. Use hydroponic root phenotyping for mechanistic studies and initial screening, with validation in more realistic substrates for advanced selections.
When Destructive Root Sampling Is Still Necessary
Today, many researchers prefer not to perform destructive testing in their research, and systems such as the Plantarum, which measures the plant from root to shoot, prevent this. However, destructive sampling remains necessary for comprehensive root biomass determination, chemical composition analysis (ion content, metabolite profile), and detailed anatomical studies (root sections, cortical anerenchyma development). When destructive and non-destructive approaches are combined, sufficient replicates should be included to support both types of measurement without compromising statistical power for either analysis stream.
What Physiological Measurements Complement Imaging in Saline Stress Plant Research?
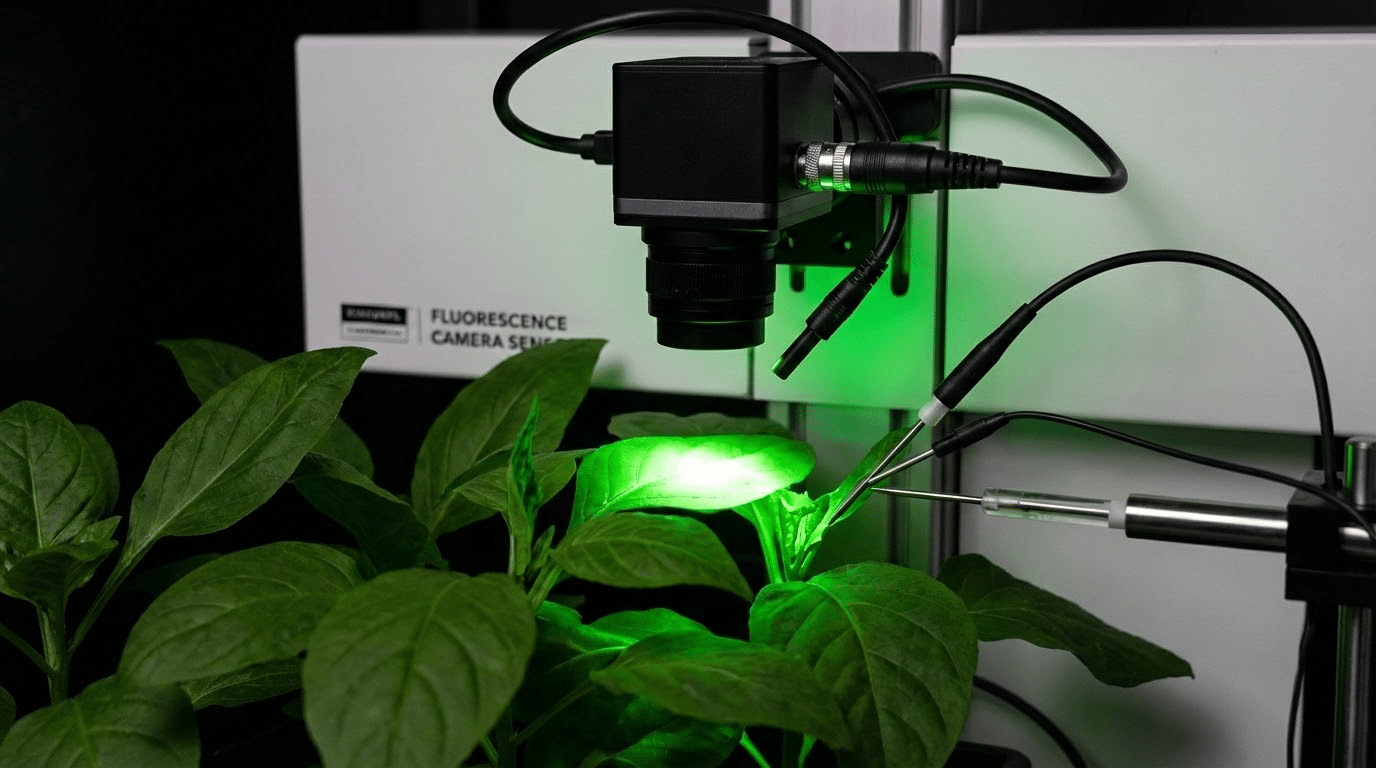
Imaging-based phenotyping is truly powerful when combined with targeted physiological measurements that validate mechanisms and calibrate metrics much more precisely. Leaf gas exchange measurements (photosynthetic rate, stomatal conductance, turbidity) provide direct physiological values that precede imaging metrics. Handheld chlorophyll a meters (SPAD) offer rapid estimates of chlorophyll content that are correlated with fluorescence and color measurements. Tissue ion analysis (Na+, K+, Cl- concentrations) connects symptom observations to baseline ionic stress levels. Relative water content and osmotic potential measurements characterize the water status of the plant during osmotic stress. Using advanced systems such as the PlantArray, it is now possible to measure hundreds of plants simultaneously and in real time.
How Do You Integrate Ion Content Data with Phenotyping Outputs?
Ion content measurements provide mechanistic context for phenotyping observations and can improve prediction models. The K+/Na+ ratio in leaf tissue often correlates with tolerance mechanisms—tolerant genotypes typically maintain higher ratios through Na+ exclusion, compartmentalization, or enhanced K+ retention (Munns & Tester, 2008). Relating ion concentrations to imaging-derived senescence metrics reveals whether damage correlates with ion accumulation as expected. Hailegnaw et al. (2025) demonstrated this directly, finding strong negative correlations between cumulative transpiration and Na+ and Cl- accumulation in both leaf tissue (r = −0.78 and −0.71) and roots (r = −0.82 and −0.66) in salt-stressed papaya. Use ion measurements from destructively sampled plants to calibrate relationships, then apply imaging-derived predictions to the full population. This approach maintains high throughput while grounding trait extraction in validated physiological relationships.
What Is the Best Way to Score Recovery After Salinity Stress?
Recovery scoring quantifies resilience—the ability to resume growth and function after stress removal or stabilization. Include a recovery phase in experimental design by reducing or eliminating salt exposure for surviving plants and continuing measurements for an additional period. Key recovery indicators include post-stress growth rate (area or biomass gain after stress removal), new leaf emergence timing and rate, and fluorescence parameter recovery toward control values. Recovery scoring distinguishes truly tolerant genotypes from those that merely decline slowly—a slow-dying plant and a resilient plant may appear similar at stress endpoint but diverge dramatically during recovery. This distinction matters greatly for breeding programs targeting environments with fluctuating salinity.
How Do You Rank Genotypes for Salt Tolerance Using Multi-Trait Data?
Multi-trait ranking integrates diverse measurements into actionable selection decisions. Simple approaches include weighted scoring systems that combine normalized trait values according to predetermined importance weights. More sophisticated methods use principal component analysis (PCA) to identify composite indices capturing major variation patterns, or stress tolerance indices that calculate performance ratios between stressed and control conditions. Ensure ranking methods control for baseline vigor differences that can confound tolerance with inherent size or growth rate. Document ranking methodology transparently, including trait weights, normalization procedures, and statistical assumptions, to enable reproduction and comparison across studies.
What Statistical Approach Is Recommended for Salinity Phenotyping Datasets?
Salinity phenotyping datasets often include repeated measures on the same plants, spatial structure from greenhouse or growth chamber layouts, and multiple correlated traits. Mixed models handle these complexities by incorporating random effects for spatial blocks and plant identity while estimating fixed effects of genotype and treatment. For time-series data, repeated-measures modeling captures temporal correlation structure and enables growth curve analysis. Report effect sizes with confidence intervals rather than relying solely on p-values, as significance depends on sample size while effect magnitude indicates practical importance. When screening many genotypes simultaneously, apply appropriate corrections for multiple comparisons to control false discovery rates.
What Drives Throughput and Cost Per Data Point in Salt Tolerance Screening?
Throughput depends on automation level, measurement time per plant, and analysis pipeline efficiency. Manual imaging and measurement create labor bottlenecks that limit practical sample sizes. Automated systems increase throughput by removing operator time from measurements per plant and streamlining irrigation so that experiments are both more accurate and more cost-effective. Cost per data point reflects labor (operation, data processing, quality control), consumables (pots, substrate, salt solutions), facility overhead, and equipment depreciation. Plant-Ditech’s integrated approach addresses these factors by combining automated data collection with analysis tools designed for physiological phenotyping workflows.
How Do You Ensure Data Quality in Plant Salinity Stress Phenotyping?
Data quality assurance requires attention throughout the experimental pipeline, not just at analysis time. Standardize metadata capture so every measurement includes plant identity, position, treatment, timing, and relevant environmental conditions. Calibrate sensors and cameras according to manufacturer specifications and document calibration dates. Validate image segmentation by visually checking algorithm outputs on representative subsets spanning the range of plant sizes and symptom levels. Establish outlier identification rules before analysis rather than making ad hoc decisions about unusual values. Monitor EC in treatment solutions throughout experiments to detect drift. Track reasons for missing data (plant death, imaging failure, processing error) to distinguish biological from technical causes.
Professional Quality Checklist
- Daily EC monitoring logs maintained and archived
- Camera calibration verified at experiment start and weekly thereafter
- Random-sample visual QC of segmentation outputs
- Reference genotype performance tracked against historical baselines
- Environmental data (T, RH, PAR) logged at regular intervals
- Missing data documented with cause codes for downstream analysis
What Are the Most Common Failure Modes in Saline Stress Phenotyping Experiments?
Understanding common failures helps teams design robust experiments. Inconsistent stress delivery—where plants receive different effective salt doses due to watering variation, substrate heterogeneity, or solution preparation errors—introduces noise that obscures genotype effects. What can solve this is precision irrigation and fertilizer systems. For example, the PlantArray system delivers irrigation and fertilizer to each plant individually so that amounts are more precise than any manual system or delivery. Uncontrolled microclimate gradients cause systematic position effects mistaken for genotype differences. Trait extraction errors arise from segmentation algorithms that fail under changed plant appearance (wilting, color shifts) or inconsistent imaging conditions. Pot weight drift in gravimetric systems can result from evaporation management failures. Equipment malfunctions during critical measurement periods can create gaps in time-series data. Pre-experiment pilot studies and established standard operating procedures reduce these failure modes.
How Do You Standardize Salinity Phenotyping Protocols Across Experiments and Seasons?
Standardization enables meaningful comparison of results across experiments, seasons, and laboratories. Fixed standard operating procedures (SOPs) document every experimental step from seed selection through final data analysis. Control stress intensity using EC measurements rather than concentration alone, since substrate effects alter effective stress levels. Include the same reference genotypes (known tolerant and sensitive lines) in every experiment to calibrate between-experiment comparisons. Maintain consistent imaging schedules (same time of day, same intervals between measurements) to control for diurnal variation in plant appearance. Use consistent calibration targets and image processing parameters. Archive raw data along with processed outputs to enable reprocessing if pipeline improvements are implemented.
What Deliverables Should a Commercial Phenotyping Provider Produce for Salt Tolerance Screening?
When outsourcing phenotyping services, specify deliverables clearly in advance. Essential outputs include raw data files in standard formats, processed trait values with clear definitions for each measurement, and comprehensive QC documentation describing data validation procedures and any excluded observations. Ranking outputs should include uncertainty estimates (confidence intervals or standard errors) rather than point estimates alone. Interpretation documents should relate findings to the client’s specific decision criteria and recommend next steps. A trait dictionary explaining exactly what each measurement represents and how it was calculated enables independent verification. Experiment reports should describe methods in sufficient detail for reproduction, including stress imposition protocols, imaging schedules, and analysis pipeline specifications.
What Questions Should You Ask Before Outsourcing Plant Salinity Stress Phenotyping?
Informed purchasing decisions require understanding provider capabilities and alignment with your needs. Ask about reproducibility: what evidence demonstrates consistent results across experiments? Inquire about throughput capabilities and timelines for your specific sample numbers. Understand which sensors and imaging modalities are available and how they match your trait requirements. Request transparency about analysis methods: how are traits extracted, what algorithms are used, how is segmentation validated? Ask how results translate to your specific crop, growth stage, and target environment. Clarify data ownership, format specifications, and access to raw data. Request example reports from previous experiments to evaluate output quality and interpretability. Discuss ability to customize stress profiles, measurement schedules, and analysis approaches for your experimental objectives.
How Does Salinity Phenotyping Support Product Development Across Applications?
Salinity phenotyping accelerates development timelines across diverse application areas by providing measurable endpoints and early success indicators. Biostimulant and treatment developers use dose-response phenotyping to identify optimal application rates and demonstrate efficacy under controlled conditions before field trials. Gene editing programs screen modified lines for enhanced tolerance phenotypes, rapidly identifying promising constructs for advancement. Breeding programs use phenotyping to narrow large populations to manageable numbers before expensive multi-location testing. In each application, phenotyping reduces reliance on lengthy field evaluations by generating predictive data under controlled conditions. The continuous monitoring capabilities of systems like PlantArray provide particularly rich datasets for understanding treatment effects and genotype-by-environment interactions.
What Distinguishes Controlled-Environment Salinity Phenotyping from Field Trials?
Controlled-environment phenotyping and field salinity trials serve complementary roles in research and selection programs. Controlled environments maximize repeatability and mechanistic clarity by eliminating weather variation, pest pressure, and spatial heterogeneity that confound field measurements. This makes them ideal for early-stage screening, hypothesis testing, and detailed physiological characterization. Field trials capture real-world variability and agronomic relevance, revealing performance under the complex conditions that ultimately determine commercial success. Validate controlled-environment selections in field salinity gradients to confirm that laboratory performance translates to practical outcomes. Use controlled phenotyping for population reduction and mechanism investigation, then advance top candidates to field validation with appropriate replication.
When Should You Move from Screening to Validation?
Transition from screening to validation when you have stable rankings across independent experimental repeats and effect sizes large enough to support confident selection decisions. Screening generates hypotheses about which genotypes are superior; validation tests those hypotheses under additional conditions. Validation experiments may use altered EC profiles to test ranking stability across stress intensities, different growth stages to assess developmental consistency, or mixed-salt conditions to evaluate performance under more field-realistic chemistry. Confirm phenotyping-based rankings with ion content measurements and, where feasible, yield-related traits to connect controlled-environment observations to agronomically meaningful outcomes. Validation strengthens confidence before investing in expensive field programs or commercial advancement.
Industry Recognition
“This system (The PlantArray) allows us, within few weeks only, to make initial selection, sort, exclude unresponsive candidates and decide, with high confidence, whether to proceed with the field experiment or return to the lab. This way, it shortens the development process, focuses and refines it, saving valuable time and money resources.”
— Hillel Magen, VP of Agronomy, ICL (Israel Chemicals Ltd.)
Frequently Asked Questions
What is plant salinity stress phenotyping used for?
Plant salinity stress phenotyping provides quantitative measurements of how plants respond to salt stress, enabling researchers and breeders to compare genotypes, evaluate treatments, and select superior lines for advancement. Applications include breeding program selection, biostimulant development, gene editing validation, and basic research into stress tolerance mechanisms.
How do you measure salt tolerance in plants?
Salt tolerance measurement combines growth trait assessment (biomass, leaf area, growth rate), stress symptom quantification (chlorosis, necrosis progression), and physiological indicators (photosynthetic parameters, ion content). Imaging systems provide relatively partial measurements, while physiological tests throughout the day identify and validate mechanisms, providing accurate and quantified results long before visual signs are apparent.
What is the best salt concentration for screening salt tolerance?
The optimal concentration creates measurable separation among genotypes without causing uniform failure across the population. Pilot experiments with concentration gradients identify the discrimination range for specific species and experimental systems. Document EC values rather than molar concentrations alone to enable cross-study comparisons.
How long does a salinity stress phenotyping experiment take?
The length of time depends on the species, growth stage, and experimental goals, and of course the technology with which you are performing the experiment. If using a physiological system, vegetative or reproductive assessments often take several weeks, while if waiting for visual characteristics it can take several months. To perform a rapid and efficient experiment, multiple time points should be included to capture both early osmotic responses and later ionic phase effects, in addition to recovery periods if robustness assessment is relevant.
What traits indicate salt tolerance at the seedling stage?
Informative seedling traits include growth rate maintenance relative to controls, chlorosis onset timing, root elongation rate, and early fluorescence parameter changes. Time-series measurements improve discrimination compared to single-timepoint assessments. Note that seedling tolerance may not fully predict adult plant or yield performance.
How do you validate salt tolerance screening results?
Validation uses independent experiments under varied conditions (different EC levels, growth stages, or salt compositions) to confirm ranking stability. Connect phenotyping results to ion content measurements and, where possible, yield-related traits. Field validation in naturally saline environments provides ultimate confirmation of practical tolerance.
Ready to Accelerate Your Salt Tolerance Research?
Whether you are screening breeding populations, evaluating stress-mitigation products, or investigating tolerance mechanisms, quantitative phenotyping provides the foundation for confident decisions.
Contact Plant-Ditech for Expert Consultation
Join research teams in 20+ countries already benefiting from precision phenotyping solutions
Last Updated: February 2026 | Reviewed by: Plant-Ditech Research Team
Based on: Practical implementation across 20+ countries and support for dozens of studies worldwide