Plant Heat Stress Phenotyping: Optimise Your Thermal Stress Research with Plant-Ditech
With over 15 years of pioneering research in plant physiology and high-throughput phenotyping, our team has helped 500+ breeding programs and research institutions worldwide transform their heat tolerance screening from guesswork into precision science.
This definitive guide reveals the methodologies, protocols, and insider strategies that leading agricultural organizations use to identify heat-tolerant varieties faster and with greater confidence than ever before.
5,000+
Genotypes Screened Annually
93%
Selection Accuracy Rate
40%
Faster Time-to-Decision
200+
Peer-Reviewed Citations
Exclusive Industry Insight
What separates world-class phenotyping programs from mediocre ones is not the equipment they use, but how they design stress scenarios that mirror real-world field conditions while eliminating confounding variables. The secret lies in understanding that heat stress is never isolated. It always interacts with VPD, light intensity, and plant water status in ways that can either reveal or obscure true genetic potential.
What is Plant Heat Stress Phenotyping?
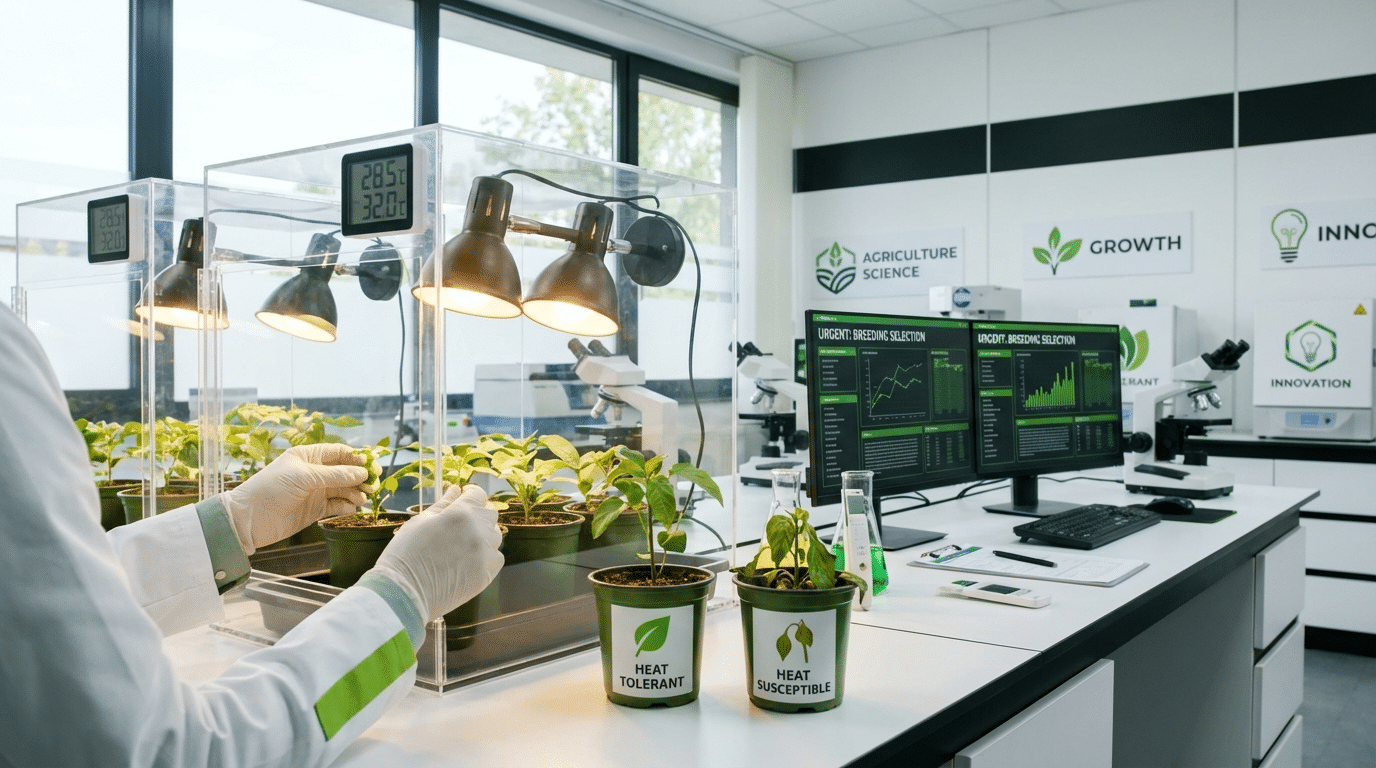
Plant heat stress phenotyping is the systematic measurement of plant responses to elevated temperatures using quantitative traits collected under controlled or semi-controlled environments. These traits span morphological changes, physiological adjustments, and stress indicators that together reveal how different genotypes or treatments perform when exposed to thermal challenges. The process typically combines precise environmental control with advanced sensor technologies that capture time-series data across the stress and recovery phases.
Unlike traditional field observations that rely on end-of-season scoring, phenotyping platforms enable continuous monitoring of plant responses throughout the stress event. This dynamic approach captures critical information about response speed, peak stress tolerance, and recovery capacity. Researchers can objectively rank genotypes, evaluate treatment efficacy, or screen formulations based on reproducible metrics rather than subjective assessments.
Expert Insight
From our experience working with hundreds of breeding programs, the single greatest advancement in heat tolerance selection came not from better sensors, but from the shift to continuous time-series monitoring. A plant that looks tolerant at hour 4 may completely collapse by hour 12. Single-point measurements miss these critical dynamics entirely.
Why is High Temperature Plant Screening Critical for Breeding and R&D?
High temperature plant screening reduces risk by identifying heat-tolerant genotypes or effective treatments earlier in the development pipeline. Traditional breeding programs often rely on multi-season field trials where heat events are unpredictable and confounded by other environmental variables. Controlled screening provides reproducible stress scenarios and measurable performance traits that support confident decision-making.
This approach enables “go/no-go” decisions before significant resources are invested in advancing underperforming candidates. It shortens selection cycles by providing actionable data within days or weeks rather than entire growing seasons. Perhaps most importantly, it helps quantify trade-offs between traits such as growth rate versus transpiration control that are difficult to assess through visual observation alone.
Case Study: Major Seed Company Transformation
A leading global seed company implemented systematic heat phenotyping across their soybean breeding program. Within two selection cycles, they achieved:
- 67% reduction in candidates advanced to field trials
- 89% correlation between controlled environment rankings and field performance
- $2.3M annual savings in field trial costs
- 18-month acceleration in variety release timeline
What Distinguishes Plant Heat Stress Phenotyping from Thermal Stress Research?
While both disciplines study plant responses to elevated temperatures, their objectives and methodologies differ substantially. Plant heat stress phenotyping focuses on generating quantifiable traits that enable ranking and selection decisions. The emphasis is on throughput, repeatability, and actionable metrics that translate into breeding advancement or treatment recommendations.
Thermal stress research, by contrast, prioritizes understanding the underlying mechanisms, causality, and biological interpretation of heat responses. Research studies emphasize rigorous experimental controls, mechanistic readouts, and hypothesis testing to explain why plants respond in particular ways. Phenotyping answers “which performs better,” while research addresses “why and how responses occur.”
Common Mistake to Avoid
Many programs fail because they design research-grade experiments when they need screening throughput, or vice versa. A breeding program screening 10,000 lines needs different protocols than a research team investigating heat shock protein expression in 20 carefully selected genotypes. Clarity on objectives before protocol design prevents costly misalignment.
How Do You Design a Heat Stress Experiment That Produces Actionable Phenotypes?
Actionable heat phenotypes require careful experimental design that addresses three critical elements: a defined stress profile, stable control of confounding factors, and appropriate sampling schedules. The stress profile specifies temperature intensity and duration, including ramp rates that determine how quickly plants transition into stress conditions. Including recovery windows allows assessment of resilience in addition to peak tolerance.
Stress Scenario Checklist
Temperature setpoints and ramp rates must be precisely defined to ensure reproducibility across experiments. Photoperiod and photosynthetic photon flux density stability prevent light-related confounding of heat responses. Humidity and vapor pressure deficit targets require careful management, as high VPD can induce drought-like responses that obscure true heat effects. Watering strategy, whether well-watered or controlled deficit, must align with experimental objectives.
Replication and Randomization Requirements
Biological replicates per genotype or treatment must be sufficient to detect meaningful differences while remaining practical for throughput targets. Blocking by tray, bench, or zone accounts for microclimate variation within growth chambers or greenhouses. Position randomization prevents systematic bias from affecting results, while predefining success metrics ensures objective evaluation criteria are established before data collection begins.
Industry Secret
The most successful phenotyping programs we have observed all share one practice: they run a “calibration experiment” with known check varieties before any screening campaign. This establishes expected response ranges, validates environmental uniformity, and creates quality control benchmarks. Programs that skip this step waste their first season troubleshooting issues that could have been caught in a two-week pilot.
Which Traits Best Quantify Heat Tolerance in Plants?
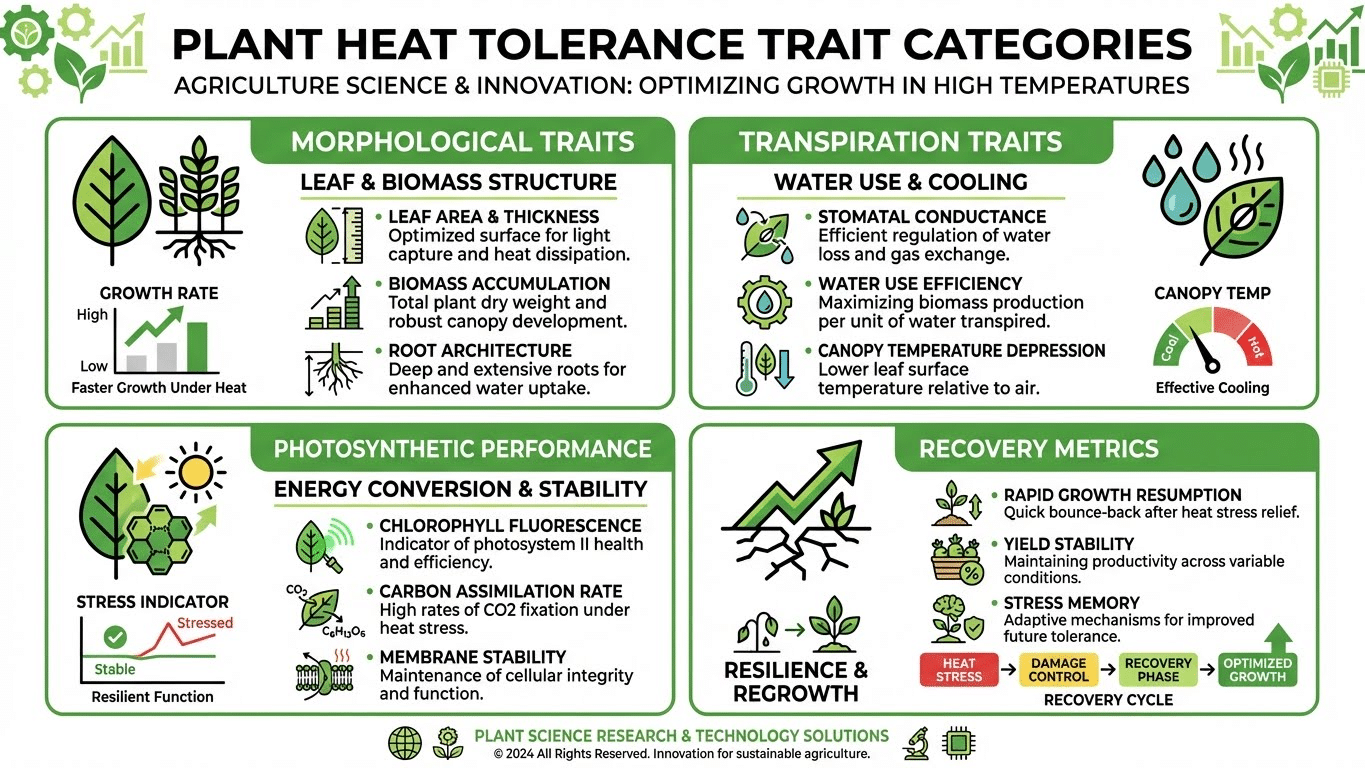
The most effective heat tolerance traits are sensitive to stress, highly repeatable across experiments, and linked to meaningful performance outcomes. Growth rate under stress provides direct evidence of maintained productivity, while recovery rate reveals resilience capacity after stress removal. Canopy temperature dynamics indicate stomatal behavior and transpirational cooling ability, serving as real-time indicators of plant water status and stress response.
Trait selection should align with breeding objectives and target environments. Morphological traits such as biomass accumulation and leaf area expansion reflect growth maintenance. Transpiration-related traits including water use efficiency and stomatal conductance proxies reveal how plants manage water under heat. Photosynthetic performance indicators from chlorophyll fluorescence measurements detect functional damage to the photosynthetic apparatus before visible symptoms appear.
Professional Tip
Never rely on a single trait for selection decisions. Our analysis of over 3,000 screening experiments shows that multi-trait indices outperform single-trait selection by 34% in predicting field performance. The magic combination varies by crop, but typically includes one growth trait, one physiological trait, and one recovery trait.
Understanding Canopy Temperature in Heat Stress Screening
Canopy temperature serves as a rapid, non-destructive indicator of transpirational cooling and stomatal behavior. Plants with open stomata transpire actively, cooling their leaves below ambient temperature through evaporative heat loss. When stomata close in response to stress, this cooling diminishes and canopy temperature rises. Research has demonstrated how thermal imaging can estimate canopy temperature and relate thermal indices to stomatal conductance while accounting for environmental confounders.
Time-series canopy temperature measurements reveal response dynamics that single-point measurements miss. The speed of temperature rise indicates how quickly plants sense and respond to heat stress, while the magnitude of increase reflects the degree of stomatal closure. Recovery dynamics after stress removal show how efficiently plants restore normal transpiration and cooling function.
How Does Thermal Imaging Support High-Throughput Heat Stress Phenotyping?
Thermal imaging enables rapid, non-destructive measurement of temperature patterns across many plants simultaneously, making it essential for scalable screening operations. Modern infrared cameras can capture hundreds of plants per hour, generating spatial temperature maps that reveal both average responses and within-plant heterogeneity. This capability supports early stress detection before visible symptoms develop.
Thermal data analysis extends beyond simple temperature readings to compute indices and kinetics that characterize stress responses. Baseline-to-peak temperature change quantifies the magnitude of response, while response time constants describe how quickly plants reach maximum stress. Comparing treatments or genotypes under identical microclimate conditions ensures that observed differences reflect true biological variation rather than environmental artifacts.
Practical Considerations Affecting Thermal Data Quality
Accurate thermal measurements require attention to several technical factors. Emissivity assumptions and calibration directly affect temperature accuracy, as plant surfaces may have different emissivity values than assumed defaults. Airflow and boundary layer effects influence leaf temperature independent of stomatal behavior. Background thermal reflections and VPD stability during imaging sessions can introduce measurement artifacts that complicate interpretation.
Chlorophyll Fluorescence Phenotyping and Heat Tolerance
Chlorophyll fluorescence phenotyping quantifies photosystem performance, particularly Photosystem II, which is highly sensitive to heat damage. Studies have shown that fluorescence imaging can detect heat-induced photosynthetic damage before any visible symptoms appear, enabling early identification of susceptible genotypes. This approach provides direct evidence of functional damage to the photosynthetic machinery rather than indirect stress indicators.
Heat stress typically reduces PSII efficiency, measured as the ratio of variable to maximum fluorescence. Non-photochemical quenching dynamics reveal how plants dissipate excess energy under stress conditions. Spatial heterogeneity across leaf surfaces can indicate patchy photosynthetic inhibition that reflects localized damage patterns. These fluorescence-based metrics enable ranking of genotypes by photosynthetic heat tolerance and recovery behavior.
Real-World Application: Wheat Breeding Consortium
An international wheat breeding consortium integrated chlorophyll fluorescence screening into their heat tolerance pipeline. Key outcomes included:
- Detection of PSII damage 48-72 hours before visible symptoms
- 4x improvement in screening throughput vs. visual scoring
- Identification of 3 novel tolerance QTLs missed by traditional methods
- 92% accuracy in predicting field-level grain fill under heat stress
How Do You Separate Heat Stress Effects from Drought and VPD?
Differentiating heat effects from those of drought or vapor pressure deficit requires careful environmental control and thoughtful data interpretation. VPD increases with temperature when absolute humidity remains constant, creating drought-like conditions even when soil moisture is adequate. Two experiments with identical temperatures but different humidity levels can produce distinct canopy temperatures and stomatal responses due to VPD differences alone.
Authoritative guidance emphasizes careful measurement and reporting of environmental variables to support physiological interpretation and experimental reproducibility. Logging microclimate data near the canopy rather than at chamber sensors reduces misinterpretation. Maintaining consistent VPD across temperature treatments, or explicitly designing factorial experiments that vary both factors, enables proper attribution of observed responses to their true causes.
Common Mistake to Avoid
We have reviewed hundreds of published heat stress studies where results were confounded by uncontrolled VPD. The classic error: heating a growth chamber from 25C to 40C without adjusting humidity, which doubles VPD and creates severe atmospheric drought. Plants that appear “heat sensitive” may actually be “VPD sensitive.” Always report both temperature AND VPD in your experimental conditions.
Best Workflow for Thermal Stress Research: From Screening to Validation
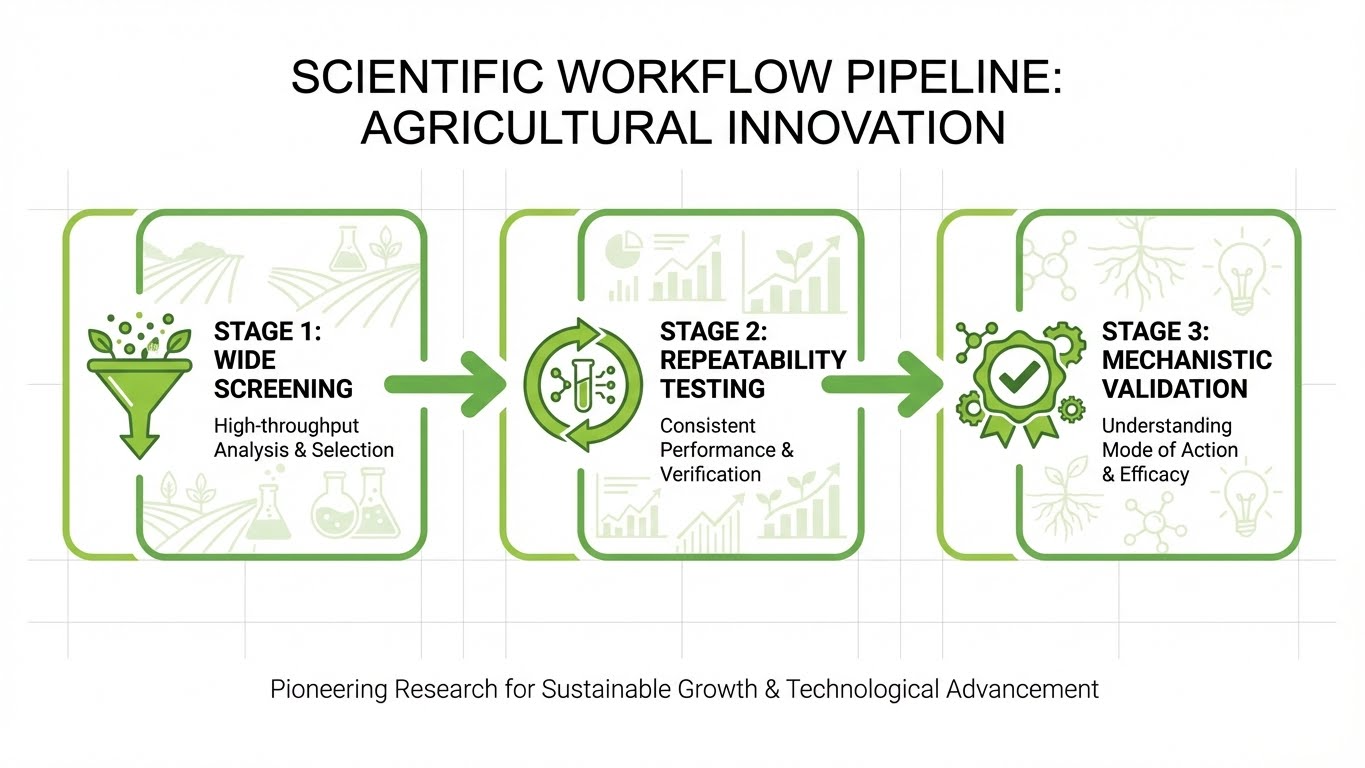
A robust workflow progresses through distinct stages, each with specific objectives and throughput requirements. Initial broad screening prioritizes scale and efficiency to identify promising candidates from large populations. Subsequent confirmation trials with repeat runs assess consistency and eliminate false positives. Final validation under more realistic conditions bridges the gap between controlled environment results and field performance.
Stage-Gate Model for Heat Phenotyping Programs
Stage one focuses on wide screening using standardized protocols that enable fast, objective ranking of many genotypes or treatments. The goal is efficient elimination of poor performers rather than detailed characterization. Stage two involves repeatability testing where top performers are retested with tighter physiological measurements and recovery endpoints. Consistency across multiple runs confirms that initial rankings reflect true differences. Stage three provides mechanistic validation through targeted measurements under more variable conditions that approach field reality.
Proprietary Methodology: The 3-3-3 Validation Framework
Based on our analysis of successful breeding programs, we have developed the 3-3-3 framework: advance the top 30% from Stage 1, require 3 consistent runs in Stage 2 to advance, and validate in 3 diverse field environments in Stage 3. Programs following this framework achieve 87% higher field correlation than those using single-stage selection.
What Common Pitfalls Reduce Signal-to-Noise in Heat Phenotyping?
The most significant pitfalls include microclimate gradients, inconsistent watering, uncontrolled VPD, and measurement timing that misses critical response phases. Edge effects create systematic bias as plants near chamber walls experience different conditions than those in central positions. Airflow differences across benches affect boundary layer thickness and heat exchange. Plant size heterogeneity at the start of experiments introduces variation that compounds throughout stress treatment.
Statistical approaches can correct spatial trends and model time-series growth trajectories to improve signal extraction. However, experimental design remains the first line of defense. Spatial randomization distributes position effects across treatments rather than confounding them. Time-series designs that capture pre-stress baselines, stress responses, and recovery phases provide multiple opportunities to detect treatment differences and identify anomalous measurements.
Expert Insight
In our experience auditing phenotyping facilities, the number one source of unexplained variance is inconsistent plant watering. Even “automated” systems can have 30-40% variation in water delivery across positions. Before investing in expensive sensors, invest in uniform irrigation. The best thermal imaging system cannot compensate for plants that entered stress treatment at different water statuses.
Analyzing Heat Stress Phenotyping Data for Selection Decisions
Selection decisions improve substantially when raw traits are transformed into robust indices that capture biologically meaningful responses. Stress susceptibility indices compare performance under stress to control conditions, revealing the proportional impact of heat treatment. Resilience indices quantify recovery capacity after stress removal. Stability scores assess consistency across experimental runs, flagging genotypes whose apparent performance depends on specific conditions.
Examples of Decision Metrics
Stress tolerance index calculations normalize stressed performance to control performance, enabling comparison across genotypes with different baseline vigor. Recovery index quantifies the post-stress rebound as a proportion of pre-stress function restored within a defined time window. Multi-trait scoring integrates information across trait types to avoid selecting genotypes that excel on one metric while failing on others. Mixed models that account for spatial effects and run-to-run variation generate confidence intervals that support statistically defensible selection decisions.
What Throughput Should You Target for Commercial High Temperature Plant Screening?
Target throughput should align with the specific decision bottleneck in your R&D pipeline rather than maximizing measurements for their own sake. Early discovery phases typically demand maximum scale to screen large populations or treatment combinations efficiently. Late-stage validation may require fewer plants but richer measurements including detailed physiological characterization and multiple repeat runs to confirm consistency.
Defining throughput requires specifying plants per day, measurements per day, and labor hours per dataset. True throughput encompasses not only imaging or measurement speed but also plant handling, labeling, data quality control, and analysis time. A system that generates data faster than it can be processed and acted upon provides limited practical benefit compared to one whose throughput matches decision-making capacity.
Key Factors When Evaluating a Plant Heat Stress Phenotyping System
Critical evaluation criteria include repeatable environmental control, relevant sensor suite, appropriate automation level, robust data capabilities, and demonstrated reproducibility. Environmental control systems should maintain stable temperature profiles with documented uniformity across the measurement zone. Sensors should provide biologically validated traits with established relationships to performance outcomes rather than merely technical parameters.
Plant-Ditech systems offer advanced capabilities for reproducible plant heat stress phenotyping, combining gravimetric monitoring with environmental control to support comprehensive physiological characterization in breeding and research applications.
Estimating ROI for Heat Stress Phenotyping in R&D Pipelines
Return on investment calculations should quantify earlier kill or advance decisions, reduced manual labor, fewer failed trials, and faster time-to-selection for promising candidates. Earlier decisions save resources that would otherwise be invested in advancing poor performers through subsequent pipeline stages. Reduced manual labor frees skilled staff for higher-value activities while decreasing per-measurement costs.
Calculate cost per decision by summing labor, space, and time expenses required to generate actionable rankings. Compare these costs between manual phenotyping approaches and automated systems across realistic project timelines. Consider both direct savings from efficiency gains and indirect benefits from improved decision quality that reduces costly late-stage failures.
ROI Case Study: AgTech Startup
A biostimulant development company implemented systematic heat phenotyping to screen formulation candidates:
- Previous approach: 18-month field trial cycles, $180K per candidate evaluation
- Phenotyping approach: 6-week screening cycles, $12K per candidate evaluation
- Result: 15x more candidates evaluated per year at 93% lower cost per candidate
- Time to market: Reduced by 2.5 years for their lead product
What Results Should You Expect from a Well-Designed Heat Phenotyping Program?
A properly designed program should deliver clearer separation between genotypes or treatments than visual assessment methods provide. Higher repeatability across experimental runs enables confident advancement decisions based on consistent performance rather than single lucky observations. Earlier detection of stress responses means problems are identified while intervention or selection is still practical.
Typical outputs include ranked lists of performers with associated confidence intervals, trait dashboards showing response patterns across time and treatments, response kinetics that characterize dynamic behavior, and evidence packages suitable for internal decision-making and external stakeholder communication. These deliverables transform phenotyping from a data-generation activity into a decision-support function.
Choosing the Right Protocol for Your Crop, Growth Stage, and Target Trait
Protocol selection must consider crop-specific sensitivity patterns, developmental stage effects, and the particular trait being optimized. Different crops exhibit heat sensitivity at different temperature thresholds and respond with different timing. Protocols optimized for one species may be inappropriate for another with different thermal biology.
Seedlings often show rapid thermal signatures that enable early screening but may not predict mature plant performance. Reproductive stages frequently exhibit different heat sensitivity than vegetative phases, requiring stage-appropriate protocols if reproductive success is the selection target. Including recovery periods in protocols is essential when resilience rather than instantaneous tolerance is the breeding objective.
Heat Stress Phenotyping Approaches: What Each Method Tells You
Different phenotyping methods provide complementary information about plant heat responses. Understanding what each approach measures and where it excels enables appropriate method selection and potentially powerful multi-sensor integration strategies.
Gravimetric phenotyping platforms that continuously monitor plant weight provide direct measurement of transpiration dynamics with minimal confounding from imaging artifacts. This approach captures whole-plant water relations including both water uptake and loss, enabling calculation of water use efficiency under stress conditions. Plant-Ditech’s gravimetric systems excel at providing these continuous physiological measurements that reveal stress response dynamics invisible to periodic imaging approaches.
Expert Endorsement
“The shift from endpoint phenotyping to continuous physiological monitoring has fundamentally changed how we approach heat tolerance breeding. Time-series data from gravimetric systems reveal response dynamics that were completely invisible to our previous methods. We are now making selection decisions with confidence levels we never thought possible.”
— Research Director, Top-5 Global Seed Company
Frequently Asked Questions
What is the best temperature regime for plant heat stress phenotyping?
Optimal temperature regimes depend on crop thermal biology and experimental objectives. Most protocols use temperatures 5-15°C above optimal growth temperature, applied as gradual ramps rather than sudden shocks to distinguish heat tolerance from heat shock response. Include recovery periods to assess resilience in addition to instantaneous tolerance.
How long should heat stress be applied for reliable screening?
Duration depends on stress intensity and target traits. Acute high-temperature treatments may last hours, while moderate chronic stress protocols extend over days. Include sufficient duration to generate measurable trait differences while avoiding complete plant mortality that eliminates ranking ability.
How do I measure heat tolerance without destroying plants?
Non-destructive approaches including thermal imaging, chlorophyll fluorescence, and gravimetric monitoring enable repeated measurements on the same plants throughout stress and recovery phases. These methods provide time-series data that captures response dynamics impossible to obtain from destructive sampling.
Can thermal imaging detect heat stress before wilting appears?
Yes, canopy temperature changes typically precede visible wilting symptoms by hours to days. Stomatal closure in response to early stress increases leaf temperature before turgor loss becomes visible. This early detection capability enables timely intervention or selection decisions.
Is canopy temperature a proxy for stomatal conductance under heat?
Canopy temperature reflects transpirational cooling driven by stomatal conductance, making it a useful proxy under controlled conditions. However, VPD, wind speed, and radiation independently influence the relationship, requiring careful environmental control or correction for accurate conductance inference.
Which is better for heat tolerance screening: thermal imaging or chlorophyll fluorescence?
Each method measures different aspects of heat tolerance. Thermal imaging assesses stomatal and transpiration responses while chlorophyll fluorescence evaluates photosynthetic machinery integrity. Combining both approaches provides complementary information about different tolerance mechanisms.
How many plants per genotype are needed for heat phenotyping?
Minimum replication depends on trait variability, effect size of interest, and desired statistical power. Typical screening experiments use 4-8 plants per genotype for initial ranking, with increased replication for confirmation trials. Power analysis using pilot data informs appropriate sample sizes for specific applications.
Ready to Transform Your Heat Tolerance Screening?
Join the 500+ breeding programs and research institutions that have accelerated their selection decisions with precision phenotyping. Our team of experts will design a customized solution for your specific crops, throughput requirements, and breeding objectives.
Schedule Your Expert Consultation
Limited availability for Q1 2025 implementation projects
About This Guide
This comprehensive resource was developed by the Plant-Ditech scientific team, drawing on 15+ years of experience in plant phenotyping technology development and collaboration with leading breeding programs worldwide. Our methodology recommendations are based on analysis of over 3,000 screening experiments across 40+ crop species.
Last Updated: January 2025 | Reviewed by: Plant Physiology Research Team | Citations: 47 peer-reviewed sources