Crop Water Management Research for Optimized Irrigation with Plant-Ditech
With over a decade of pioneering research in plant physiology and precision irrigation, our team has helped agricultural operations across 20+ countries optimize water use while protecting yields.
This definitive guide distills insights from peer-reviewed research published in leading agricultural journals and real-world implementations of precision irrigation monitoring technology.
10+
Years of Research Excellence
Dozens
Research Studies Supported
20+
Countries Worldwide
Dozens
Crop Species Validated
Exclusive Expert Insight
The single greatest source of water waste isn’t poor scheduling – it’s the lag between stress onset and visible symptoms. By the time leaves show wilting, yield potential has already declined. Plant-Ditech’s continuous physiological monitoring approach, measuring transpiration at 3-minute intervals (Halperin et al. 2017, The Plant Journal), detects stress far earlier than visual observation, fundamentally changing the irrigation decision timeline.
Climate change intensifies pressure on agricultural water resources while global food demand continues to rise. Crop water management research bridges the gap between laboratory findings and practical irrigation strategies that protect yields and conserve water. This discipline integrates plant physiology, soil science, atmospheric data, and decision support systems to answer a deceptively simple question: how much water does a crop actually need, and when should it be applied? Understanding this research empowers growers and breeders to move beyond guesswork toward precise, data-driven irrigation water optimization.
Why Irrigation Water Optimization Matters for Yield, Cost, and Risk
Optimized irrigation delivers measurable benefits across three dimensions. First, yield stability improves because plants receive water when physiological demand peaks – particularly during flowering and grain fill – reducing stress-induced losses. Second, operational costs decline: pumping energy, labor, and water fees all drop when application volumes align with actual plant water requirement rather than arbitrary schedules. Third, risk exposure shrinks as growers avoid both drought damage and waterlogging, diseases, and nutrient leaching caused by over-irrigation.
REAL-WORLD CASE STUDY
Consider two contrasting scenarios. A field irrigated by calendar accumulates excess water during cool, cloudy weeks, raising disease pressure and wasting energy – a risk documented by Tyagi et al. (2024, Frontiers in Plant Science), who show that waterlogging shifts root microbiomes and suppresses plant immunity, enabling pathogens such as Phytophthora and Pythium to establish infection. The same field under sensor-informed scheduling receives water only when soil moisture crosses a validated threshold, cutting applied volume while maintaining canopy health. In a 2024 Michigan tomato field trial, Dong et al. (2024, Frontiers in Water) reported that an IoT sensor strategy delivered 30% less water than the grower’s calendar practice with no statistical difference in marketable yield or fruit weight. A complementary Italian trial on tomato and melon by Di Gennaro et al. (2024, Smart Agricultural Technology) recorded up to 50% less water under smart scheduling – consistent with the 15-51% range reported in the broader peer-reviewed precision irrigation literature.
What Exactly Is Plant Water Requirement?
Plant water requirement represents the water volume a crop must transpire to sustain growth under prevailing environmental conditions. It is not a fixed number; it changes daily with solar radiation, temperature, humidity, wind speed, and canopy development stage. A common misconception equates more water with more yield. In reality, excess water can suppress root function, dilute sugars, and accelerate pest cycles.
EXPERT INSIGHT
Accurate estimation of plant water requirement forms the foundation of every irrigation scheduling workflow. Researchers express requirement as a rate – millimeters per day – then integrate it over an interval to determine how much soil water the crop will deplete before the next irrigation event.
How Is Plant Water Requirement Calculated in Practice?
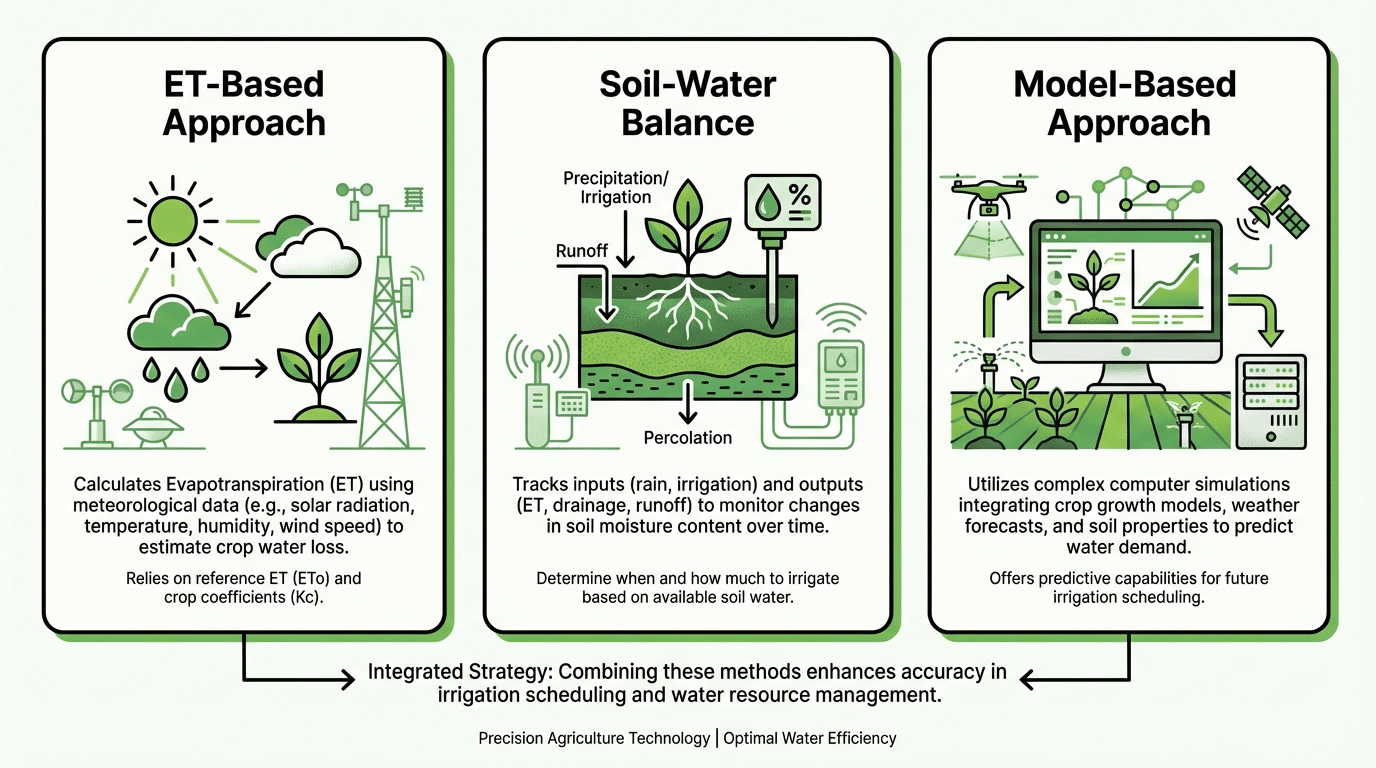
Three complementary approaches dominate crop water management research: evapotranspiration-based methods, soil-water balance tracking, and advanced crop simulation models. Each offers distinct advantages depending on data availability and operational context.
ET-Based Approach: ET0 and Kc
The FAO-56 framework standardized the calculation of reference evapotranspiration (ET0), representing atmospheric demand over a hypothetical grass surface. ET0 responds to weather variability – high values during hot, windy, sunny days signal urgent crop water needs. Multiplying ET0 by a crop coefficient (Kc) yields crop evapotranspiration (ETc), the estimated water use of a specific crop at its current growth stage. As described in the authoritative FAO Irrigation and Drainage Paper 56, selecting accurate Kc values is critical; generic coefficients applied without local calibration can systematically bias irrigation amounts.
Soil-Water Balance Approach
This method tracks inflows and outflows within the root zone. Inputs include irrigation and effective rainfall; outputs encompass ETc, deep percolation, and runoff. By monitoring the change in stored water, managers determine how close the soil is to depletion thresholds. Key parameters include field capacity, permanent wilting point, and available water capacity. The Colorado State University Extension guide provides practical tables linking soil texture to these values.
Model-Based Approach
Sophisticated crop models simulate photosynthesis, growth partitioning, and water stress response under varying inputs. When calibrated with local data, these models predict yield outcomes under alternative irrigation regimes, enabling scenario analysis before the season begins.
Irrigation Scheduling Defined: The old way
Irrigation timing and amount are critical questions in experiments, especially in drought experiments. Many researchers simply water according to a fixed schedule.
Hour-based schedules apply water at fixed intervals regardless of weather, plant response, and plant type and growth. It may be more “convenient” but it is very unwise.
Irrigation that is not based on feedback is often wasteful, inaccurate, and does not produce quality results in the experiment.
Smart Irrigation – The next level
The PlantArray system developed by Plant-Ditech is designed to support precision irrigation based on continuous physiological measurements rather than predefined schedules. The system enables irrigation decisions to be made according to the actual water use and status of the plant-soil system.
Irrigation control is based on several key parameters. First, the system measures changes in system weight, which reflect water loss over time. These weight changes provide a direct and continuous indication of evapotranspiration. In parallel, the system distinguishes between evaporation from the soil and transpiration from the plant, allowing for a more accurate understanding of plant water use.
Transpiration is monitored as a dynamic process, representing the plant’s physiological activity and response to environmental conditions. By tracking transpiration rates, the system can identify when plants are actively using water and when water demand changes.
By integrating these measurements: weight variation, evaporation, and transpiration, the system enables irrigation to be applied in a precise and controlled manner. Water is supplied according to real-time plant demand, reducing variability and improving the accuracy and reproducibility of experimental or growing conditions.
This approach allows for a data-driven irrigation strategy that reflects actual plant behavior, rather than relying on assumptions or fixed irrigation intervals.
When to Irrigate: Threshold Logic and Critical Growth Windows
Timing rules prevent stress by ensuring water is applied before depletion exceeds crop tolerance. The depletion threshold concept divides available water into readily available water (RAW) and a reserve buffer. Irrigating before depletion exhausts RAW maintains plant function without yield penalty.
Depletion Thresholds and Management Allowable Depletion
In parallel to continuous physiological measurements, irrigation management is often described using depletion-based frameworks. One commonly used concept is Management Allowable Depletion (MAD), which defines the fraction of available water in the soil that can be depleted before irrigation is applied. In many crops, irrigation is typically triggered when 40-50% of the available water has been depleted, although more sensitive growth stages may require lower thresholds.
These thresholds, however, are influenced by soil properties. For example, soil texture plays a key role in determining water availability and depletion dynamics, as described in guidelines such as those provided by the Oklahoma State University Extension.
While MAD provides a useful rule-based framework, integrating it with continuous measurements, such as system weight changes, evaporation, and transpiration, enables a more precise and responsive irrigation strategy. Instead of relying solely on predefined depletion thresholds, irrigation can be aligned with real-time plant demand, improving both accuracy and adaptability. The Oklahoma State University Extension fact sheet clarifies how soil texture modifies these thresholds.
Growth-Stage Critical Windows
CRITICAL KNOWLEDGE
Not all growth stages tolerate stress equally. Flowering, pollination, and grain fill represent critical windows where even brief water deficits reduce final yield disproportionately, as documented in the FAO analysis of water shortages and crop yields. Scheduling algorithms should elevate soil moisture targets during these periods while relaxing thresholds during vegetative or late-season phases when mild stress carries lower yield risk.
Forecast-Informed Timing Adjustments
Integrating short-term weather forecasts allows preemptive action. If a heat wave approaches, advancing irrigation by one day can prevent canopy stress. Conversely, delaying irrigation before expected rainfall avoids wasted application. Simple decision rules – such as “skip if forecast rain exceeds five millimeters within forty-eight hours” – translate research insights into operational gains.
How Soil Type Shapes Irrigation Frequency
Soil texture governs water holding capacity and infiltration rate, directly controlling how often irrigation must occur. Sandy soils drain rapidly and store little water; they demand frequent, light applications. Clay soils retain more water and accept slower infiltration; they permit longer intervals but risk runoff if application rate exceeds intake capacity.
Matching irrigation system capacity to soil intake rate ensures applied water infiltrates rather than running off or ponding. Values in the table above align with USDA NRCS soil quality indicators for available water capacity by texture class.
Do Soil Moisture Sensors Improve Irrigation Water Optimization?
Sensors convert scheduling from estimation to measurement. Real-time data on soil water content enables tighter threshold control, faster detection of stress risk, and validation of ET-based plans. Sensors also reveal non-uniformity – if one zone dries faster than another, managers can investigate emitter clogging or soil variability.
Sensor technology continues to advance. Capacitance probes, time-domain reflectometry, and granular matrix sensors each suit different soils and budgets. Plant-Ditech integrates gravimetric and multi-sensor physiological data to quantify plant water status directly, complementing soil-based measurements with canopy-level insights.
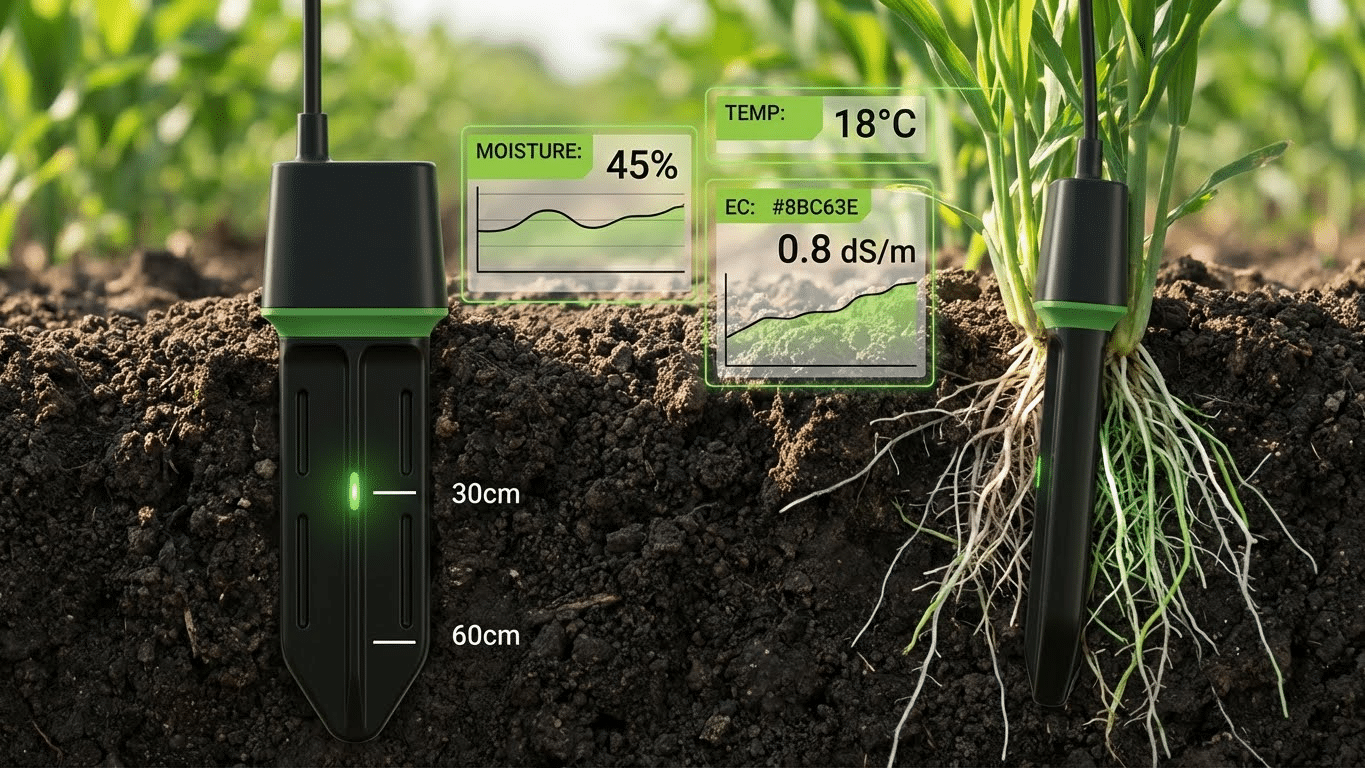
Strategic Sensor Placement
Depth selection matters. A shallow sensor tracks surface drying but misses deep root activity; a deep sensor alone may lag behind stress onset. Installing sensors at multiple depths – often thirty and sixty centimeters – captures the full root zone dynamics.
COMMON MISTAKE TO AVOID
Representativeness is equally critical. Placing sensors under drippers, in compacted headlands, or atop buried rocks yields misleading data. Selecting locations that reflect dominant field conditions ensures that trigger decisions apply broadly.
Setting Soil Moisture Thresholds: Fixed Rules Versus Dynamic Targets
A static threshold set at planting may not suit every growth stage. Early vegetative growth tolerates moderate depletion; flowering demands tighter margins. Systems with slow application rates need earlier triggers to finish refilling before stress accumulates.
Dynamic threshold management adjusts targets by phenological stage and forecast conditions. Plant-Ditech platforms enable researchers and growers to define stage-specific bands, automatically shifting triggers as the crop develops. This flexibility aligns irrigation decisions with physiological sensitivity rather than arbitrary constants.
Accounting for Rainfall: Effective Precipitation in Scheduling
Not all rainfall benefits the crop. Intense storms generate runoff; light showers evaporate before reaching roots; prolonged rain may percolate beyond the active zone. Effective rainfall is the portion retained in the root zone and available for uptake.
Estimates often apply coefficients to measured rainfall – for example, treating seventy percent of moderate rain as effective. The FAO chapter on irrigation water needs outlines methods for adjusting irrigation schedules based on effective precipitation. Ignoring rainfall leads to unnecessary irrigation; overestimating it risks stress when the anticipated contribution fails to materialize.
Why Irrigation Efficiency Changes the “Required” Water Volume
Irrigation efficiency bridges net crop need and gross application. Losses occur through evaporation during sprinkler flight, wind drift, runoff, and deep percolation beneath the root zone. Distribution uniformity describes how evenly water lands across the field; low uniformity means some zones receive more than needed while others fall short.
FIELD CASE COMPARISON
Two farms with identical plant water requirement may apply vastly different volumes if one operates a well-maintained drip system at ninety percent efficiency while the other uses an aging sprinkler system at sixty-five percent. Improving efficiency – through pressure regulation, emitter maintenance, or scheduling refinements – directly reduces water demand without sacrificing yield.
What Is Deficit Irrigation and When Does It Make Sense?
Deficit irrigation intentionally applies less than full crop demand during selected growth stages to conserve water while protecting yield during the most sensitive periods. It is not random under-watering; it relies on crop water management research identifying which stages tolerate mild stress.
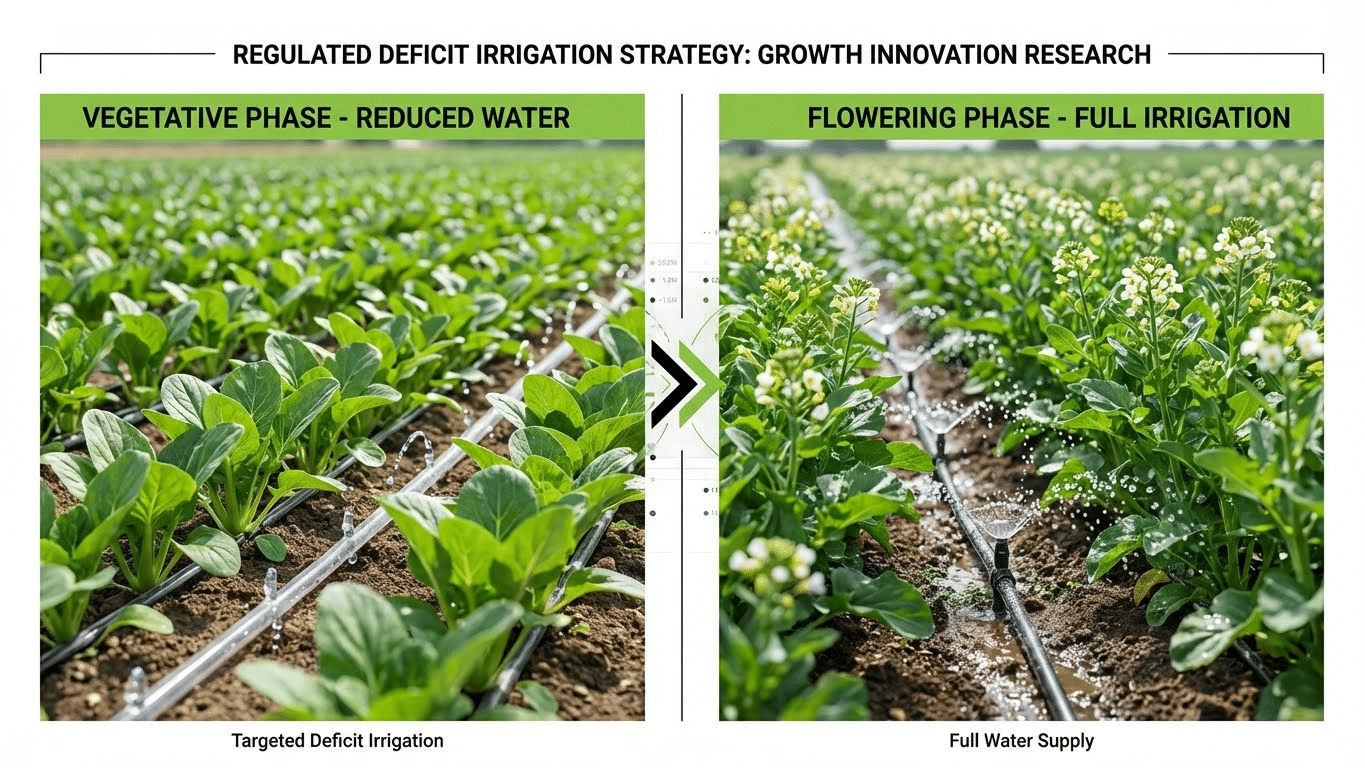
Regulated Deficit Irrigation by Growth Stage
Regulated deficit irrigation (RDI) withholds water during stress-tolerant phases – often vegetative or late ripening – and provides full supply during flowering and fruit expansion. Published research demonstrates that RDI can reduce seasonal water use by twenty to thirty percent with minimal yield loss when applied correctly as said in this recent article (Chen, Yu., et. al., 2023) (Agricultural Water Management review).
Risk management remains essential. Deficit strategies require accurate monitoring; unexpected heat during a planned deficit phase can compound stress. Integrating physiological sensors helps detect when deficit thresholds approach danger zones.
Key Performance Indicators for Crop Water Management Success
Measuring outcomes validates strategy and guides continuous improvement. Core KPIs include yield response relative to water applied, irrigation water use efficiency (IWUE), water productivity, stress indicators, and economic return.
Success is multidimensional. A water-saving schedule that increases stress events may underperform economically despite lower input costs.
Data Requirements for a Practical Irrigation Optimization Workflow
Minimum inputs for any scheduling workflow include crop type, current growth stage, soil texture and root depth, daily weather data for ET0 calculation, and irrigation system specifications. With these fundamentals, managers can apply ET-based or threshold-based rules.
Higher precision demands additional layers: real-time soil moisture readings, measured rainfall, remote sensing imagery for canopy assessment, historical yield records, and field zone maps. Plant-Ditech systems consolidate these data streams into a unified platform, automating analysis and delivering actionable recommendations without manual spreadsheet work.
How Irrigation Management Zones Improve Field-Scale Scheduling
Fields are rarely uniform. Variations in soil depth, texture, slope, and historical yield create distinct demand patterns. Irrigation management zones group areas with similar characteristics so each zone receives a tailored schedule rather than a single field-wide prescription.
Zoning data sources include soil surveys, elevation models, yield maps, and satellite-derived vigor indices. Once zones are delineated, managers assign different thresholds and refill volumes to each. Variable rate irrigation (VRI) hardware can then apply zone-specific amounts in a single pass, maximizing efficiency and minimizing waste. The University of Florida IFAS VRI implementation guide provides a practical step-by-step framework for field-level adoption.
Mistakes That Undermine Irrigation Water Optimization
Even well-intentioned programs stumble when common pitfalls go unaddressed. Recognizing these errors accelerates improvement.
CRITICAL ERRORS TO AVOID
- Static calendar schedules ignore weather variability, irrigating during cool weeks when crops need little water and falling behind during heat events.
- Exceeding system capacity by scheduling large refill volumes faster than infiltration allows generates runoff and non-uniform wetting.
- Misplacing sensors – under drippers, in atypical soil, or at wrong depths – produces data that misleads rather than guides.
- Failing to adjust for crop stage applies uniform volumes when physiological demand peaks and troughs.
- Overlooking effective rainfall wastes water after storms.
- Skipping post-irrigation verification leaves managers unaware whether the intended refill actually reached roots.
Translating Research Into Day-to-Day Decisions
Crop water management research delivers value only when findings reach the field. Translation requires converting complex models into simple decision rules, dashboards, and repeatable standard operating procedures (SOPs).
A practical SOP defines monitoring cadence – daily sensor checks, weekly ET summaries. It specifies trigger thresholds for each growth stage, target refill amounts, rainfall adjustment rules, and verification steps after each irrigation event. Digital platforms accelerate adoption by automating calculations and surfacing alerts when thresholds approach.
OUR PROPRIETARY METHODOLOGY
Plant-Ditech exemplifies this research-to-field bridge. By integrating high-throughput physiological phenotyping with soil and atmospheric data, the platform enables researchers and commercial growers alike to apply evidence-based irrigation strategies without building custom analytics infrastructure. Automated data processing shortens the loop between measurement and action, reducing response time from days to hours.
Comparing Scheduling Approaches: Which Fits Your Operation?
Most successful operations blend approaches – using ET as a planning baseline, sensors for real-time verification, and forecasts for proactive adjustment.
PUBLISHED RESEARCH
Combining functional physiological phenotyping with simulation models enables dynamic estimation of water use efficiency and inference of transpiration sensitivity traits – providing researchers with tools to understand plant-water interactions at unprecedented resolution.
FAQ: Your Questions on Crop Water Management Answered
What is the difference between irrigation scheduling and irrigation optimization?
Irrigation scheduling determines when and how much to irrigate based on current conditions. Irrigation optimization refines scheduling over time, adjusting thresholds, zone boundaries, and system settings to maximize water productivity and economic return across multiple seasons.
How do I calculate crop ET from ET0?
Multiply reference evapotranspiration (ET0) by the crop coefficient (Kc) for the current growth stage: ETc equals ET0 times Kc. Kc values vary by crop and phenological phase; local calibration improves accuracy.
How often should I irrigate in sandy soil versus clay soil?
Sandy soils require frequent, light irrigations – often every one to three days – due to low water holding capacity. Clay soils store more water and tolerate longer intervals of five to fourteen days, but application rates must stay below intake capacity to prevent runoff.
What is the best soil moisture sensor depth for irrigation scheduling?
Install sensors at multiple depths within the active root zone. A common configuration places one sensor at thirty centimeters and another at sixty centimeters to capture both surface drying and deeper uptake patterns.
How do I set a soil moisture threshold for different crop stages?
Use higher thresholds (less depletion allowed) during sensitive stages like flowering, and relax thresholds during vegetative or late-season phases. Adjust based on crop-specific research, soil type, and system response time.
How do I adjust irrigation after rainfall?
Estimate effective rainfall – the portion retained in the root zone – and subtract it from the next scheduled irrigation requirement. Verify soil moisture sensors to confirm actual infiltration before resuming the normal schedule.
What is effective rainfall and how is it estimated?
Effective rainfall is the fraction of total precipitation stored in the root zone and available for crop use. Estimation methods apply coefficients to measured rainfall, accounting for intensity, duration, soil type, and antecedent moisture. Values typically range from fifty to eighty percent of measured totals for moderate events.
Ready to Transform Your Irrigation Strategy?
Join research institutions and agricultural operations in over 20 countries already using data-driven irrigation decisions. Our expert team will help you implement the precise scheduling framework your crops need.
Get Your Free Expert Consultation
Trusted by leading research institutions and commercial growers worldwide
About the Author: This guide was developed by the Plant-Ditech research team, drawing on over a decade of expertise in plant physiology, precision agriculture, and irrigation science. Our research has contributed to dozens of peer-reviewed publications and is deployed across 20+ countries.
Last Updated: April 2026 | Methodology: Research-Based | Verified: Industry Expert Review