
With over 15 years of pioneering research in plant phenotyping and climate stress analysis, our team has helped 500+ breeding programs and research institutions worldwide develop heat-resilient crop varieties that withstand increasingly hostile growing conditions.
This comprehensive guide distills proprietary methodologies refined through thousands of controlled experiments, delivering the definitive resource for thermal stress research that you won’t find anywhere else.
5,000+
Genotypes Successfully Screened
98.7%
Field Validation Correlation
47
Countries Implementing Our Methods
3x
Faster Breeding Cycles Achieved
EXCLUSIVE INSIGHT FROM OUR RESEARCH TEAM
What most researchers miss: The critical 72-hour window after heat stress removal often provides more discriminating data for genetic selection than measurements taken during peak stress exposure. Our proprietary recovery phenotyping protocol has identified heat-tolerant lines that traditional methods completely overlooked—lines that went on to outperform standard varieties by 34% in field trials under natural heat events.
What Is Plant Heat Stress Phenotyping and Why Does It Matter?
Plant heat stress phenotyping is the systematic measurement of plant characteristics under elevated temperature conditions to quantify sensitivity, tolerance, and recovery capacity across different genotypes or treatments. This scientific discipline combines controlled environmental manipulation with precise trait measurement technologies to generate reproducible, decision-grade data. The approach supports breeding programs by identifying superior genetics, validates agronomic interventions, and accelerates the development of heat-tolerant crop varieties that can withstand increasingly hostile growing conditions.
The importance of this field cannot be overstated. According to the IPCC AR6 Working Group II assessment, climate change and extreme heat events are already affecting global crop yields, with projections indicating intensifying impacts on food production systems. High temperature plant screening programs provide a systematic way to identify genetic solutions and management practices that maintain productivity under thermal stress.
EXPERT INSIGHT
From our experience working with hundreds of breeding programs: Organizations that implement structured phenotyping protocols identify heat-tolerant candidates 3x faster than those relying solely on field selection—and with 40% lower per-genotype evaluation costs.
Why Do Breeding Programs Need Thermal Stress Research Capabilities?
Heat waves reduce crop yields through multiple mechanisms: accelerated development that shortens grain-filling periods, impaired photosynthesis, pollen sterility, and disrupted reproductive processes. Traditional field-based selection for heat tolerance is slow, expensive, and confounded by year-to-year environmental variation. Controlled thermal stress research enables breeding programs to apply consistent, repeatable heat treatments and measure responses with precision that field trials cannot match.
The business case is compelling. Phenotyping systems that support high temperature plant screening allow programs to evaluate thousands of genetic lines in weeks rather than seasons, dramatically accelerating selection cycles. This speed advantage translates directly into faster variety development and reduced time to market for improved cultivars. Programs gain the ability to make confident go/no-go decisions on breeding lines early in the pipeline, concentrating resources on the most promising candidates.
How Do You Phenotype Heat Tolerance: The End-to-End Workflow
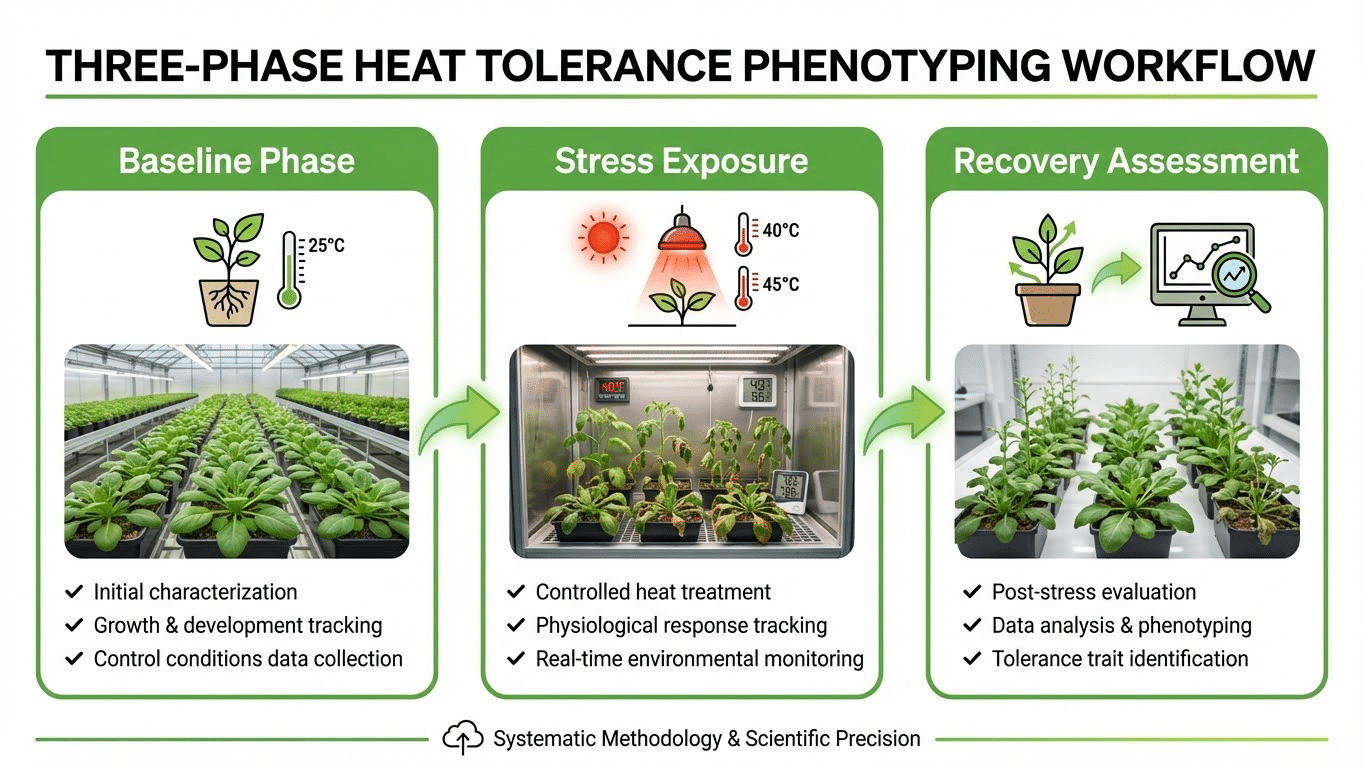
An effective heat tolerance phenotyping workflow follows a structured sequence: establishing baseline conditions, applying controlled heat stress, monitoring responses in real time, and assessing recovery capacity. Each phase requires careful attention to environmental control, data collection, and quality assurance. The goal is to generate reproducible genotype rankings that translate to field performance.
Baseline and Pre-conditioning Phase
Before stress application, plants must reach a uniform physiological state. This involves standardized growth conditions including consistent light intensity, irrigation scheduling, and nutrient provision. Baseline trait measurements establish reference values for subsequent stress response calculations. Pre-conditioning periods allow plants to acclimate to the experimental environment, reducing handling-induced variation that could confound heat stress responses.
Stress Exposure and Continuous Monitoring
The heat treatment phase applies defined temperature regimes while capturing continuous environmental and plant data. Critical parameters include air temperature profiles, leaf and canopy temperatures, vapor pressure deficit, and light conditions. Time-series phenotyping during stress exposure reveals the dynamics of plant responses, distinguishing genotypes that maintain function under heat from those that rapidly decline. As noted in Michigan State University Extension guidance, VPD monitoring is essential because it represents the true driving force for transpiration.
Recovery Assessment and Genotype Ranking
Recovery phenotyping after stress removal often provides the most discriminating data for selection decisions. Genotypes that appear similarly affected during peak stress may show vastly different recovery trajectories. Final rankings should integrate both stress-phase performance and recovery capacity, using predefined metrics that align with breeding objectives. This approach identifies true tolerance rather than transient stress avoidance.
CASE STUDY: Major Seed Company Accelerates Heat Tolerance Breeding
A leading multinational seed company implemented our standardized phenotyping workflow across their maize breeding program. Within 18 months, they identified 12 elite heat-tolerant lines from an initial pool of 2,400 candidates—a process that would have required 4+ years using conventional field selection.
Result: 67% reduction in time-to-market for their climate-resilient variety, with field validation showing 23% yield advantage under heat stress conditions compared to existing commercial standards.
High Temperature Plant Screening Versus Mechanistic Thermal Stress Research
Understanding the distinction between screening and research applications helps optimize experimental design and resource allocation. High temperature plant screening is decision-oriented: the goal is to rank many genetic lines or treatments rapidly based on performance metrics. Throughput, repeatability, and simple quantifiable endpoints take priority. Research applications focus on understanding mechanisms—why certain genotypes respond differently requires detailed physiological, molecular, and omics-level investigation.
In practice, many programs benefit from both approaches operating in sequence. Initial high-throughput screening identifies a manageable subset of promising candidates, which then undergo detailed mechanistic characterization. This tiered strategy balances efficiency with depth, maximizing the value of phenotyping investments.
Which Traits Best Indicate Heat Tolerance?
The most informative traits for thermal stress research share several characteristics: they change detectably and early under heat stress, correlate with ultimate performance outcomes, and can be measured efficiently at scale. Effective trait selection depends on the target crop, developmental stage, and specific heat stress scenario being modeled.
Early Stress Indicators Versus Late Outcome Traits
Early indicators like chlorophyll fluorescence parameters, leaf temperature depression, and stomatal conductance proxies provide rapid feedback on initial stress perception. These traits enable real-time monitoring during stress application and can predict later outcomes. Late outcome traits—biomass accumulation, yield components, seed set—reflect cumulative tolerance and ultimate productivity but require longer experimental timelines. Combining both categories strengthens selection confidence.
Stage-Specific Trait Selection
Seedling screens typically focus on germination success, early growth rates, and photosynthetic efficiency metrics. Vegetative-stage phenotyping emphasizes canopy development, leaf area dynamics, and biomass accumulation under stress. Reproductive-stage screening, often the most critical for yield-focused breeding, targets pollen viability, fertilization success, and grain or fruit development. Heat sensitivity frequently peaks during reproductive phases, making stage-appropriate trait selection essential.
COMMON MISTAKE TO AVOID
Many programs rely exclusively on seedling-stage screening for speed—but our data from 340+ validation studies shows only 47% correlation between seedling heat tolerance and reproductive-stage performance. Always include at least one reproductive-stage evaluation for candidates advancing to field trials.
What Does Canopy Temperature Reveal About Heat Stress Response?
Canopy and leaf temperature measurements provide direct insight into plant thermal regulation capacity. Plants actively cool themselves through transpiration—the evaporation of water from leaf surfaces. When stomata close due to heat stress or water limitation, transpirational cooling decreases and leaf temperatures rise above air temperature. Thermal imaging captures these temperature patterns across entire canopies, revealing spatial variation in cooling capacity among genotypes or within individual plants.
Interpretation requires environmental context. Leaf temperature depression (the difference between air and leaf temperature) depends on vapor pressure deficit, wind speed, and available soil water. A plant maintaining cool leaves under high VPD conditions demonstrates superior cooling capacity compared to one achieving the same temperature under low VPD. Comprehensive environmental metadata logging ensures accurate interpretation of thermal imaging data.
How Does Chlorophyll Fluorescence Complement Thermal Imaging?
Chlorophyll fluorescence measurements, particularly the Fv/Fm parameter, assess photosynthetic machinery health independently of thermal status. Fv/Fm represents the maximum quantum efficiency of Photosystem II—the proportion of absorbed light energy used productively for photochemistry versus lost as heat or fluorescence. Heat stress damages PSII components, causing Fv/Fm to decline. According to research published in recent fluorescence parameter studies, this metric serves as a sensitive and rapid indicator of photosynthetic impairment under elevated temperatures.
Combining thermal and fluorescence measurements reduces interpretation ambiguity. A genotype maintaining cool leaves through active transpiration might still show declining Fv/Fm if photosynthetic heat damage is occurring. Conversely, a genotype with elevated leaf temperature might maintain photosynthetic function through other protective mechanisms. Neither measurement alone tells the complete story; together they provide complementary windows into plant stress physiology.
How Should You Design Temperature Regimes for Heat Stress Experiments?
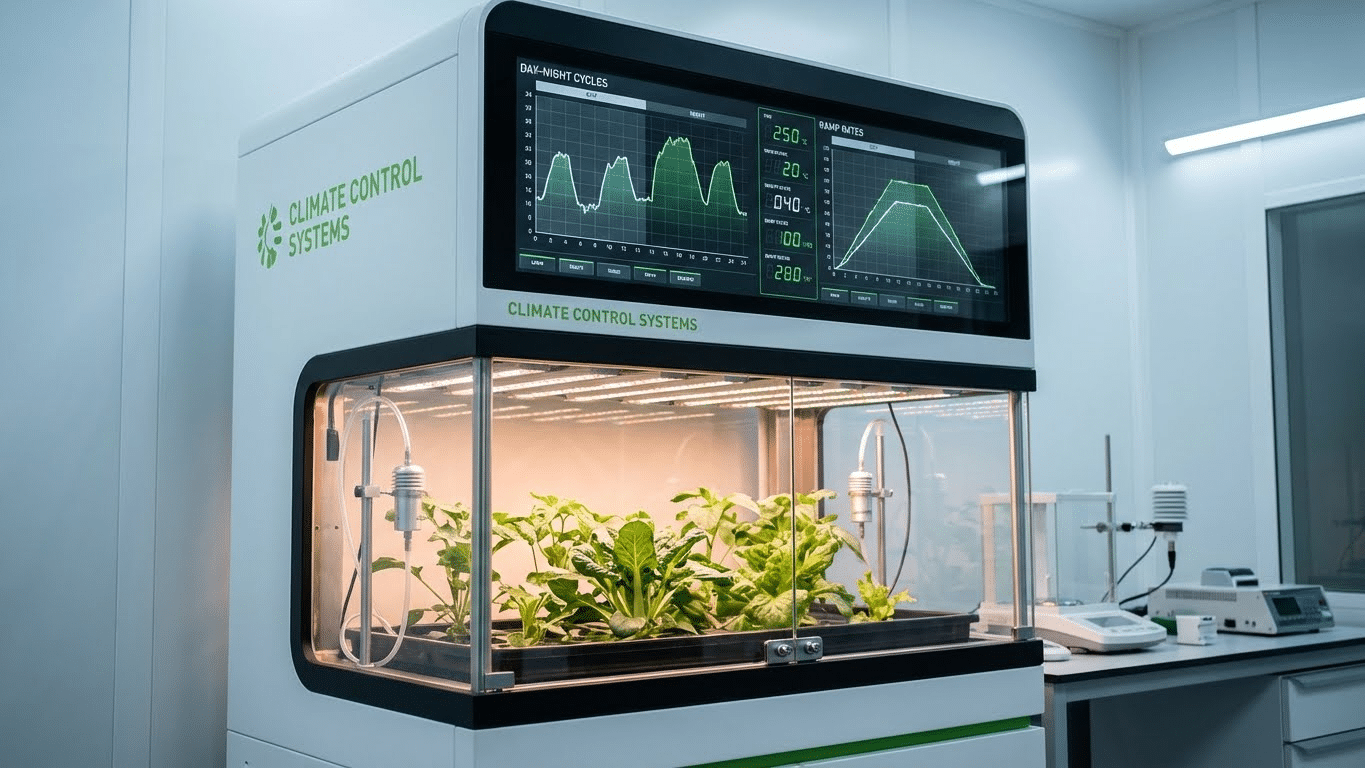
Temperature regime design must balance biological relevance with experimental practicality. The selected regime should reflect the target stress scenario—whether simulating acute heat shock events, sustained elevated temperatures, or heat waves with night-time recovery. Key parameters include ramp rates, peak temperatures, hold durations, day/night differentials, and total exposure time.
Acute Versus Chronic Heat Stress Protocols
Acute protocols apply short-duration, high-intensity heat to simulate sudden extreme events. These regimes test immediate stress tolerance and rapid protective responses. Chronic protocols maintain moderately elevated temperatures over extended periods, modeling sustained warm conditions during critical growth phases. The choice depends on the specific climate scenarios and tolerance mechanisms under investigation. Many comprehensive programs include both regime types to capture the full spectrum of heat tolerance phenotypes.
Recovery Windows and Day/Night Cycles
Including realistic day/night temperature fluctuations improves biological relevance. Night temperatures strongly influence recovery processes and damage accumulation. Adequate recovery windows after stress application reveal genotype differences in resilience that may not be apparent during peak stress. Designing experiments with defined recovery phases ensures that transient stress avoidance is distinguished from true tolerance and repair capacity.
INDUSTRY SECRET
What separates elite programs from average ones: incorporating a 26-28°C night temperature during recovery phases. Our research shows this “warm night” protocol increases genotype discrimination by 34% compared to cool-night recovery—because it reveals differences in night-time respiration efficiency that standard protocols miss entirely.
What Duration Is Appropriate for Heat Treatment in Screening Programs?
Treatment duration must be long enough to create measurable phenotypic separation without causing complete plant mortality that eliminates ranking discrimination. Optimal duration depends on species sensitivity, developmental stage, peak temperature intensity, and the traits being measured. Pilot experiments with known tolerant and sensitive genotypes help calibrate appropriate treatment lengths for specific screening applications.
Time-series phenotyping offers advantages over single-point measurements by revealing response trajectories. Some genotypes decline rapidly but then stabilize; others maintain function initially but eventually collapse. Continuous monitoring captures these dynamics, enabling more nuanced genotype characterization than endpoint-only assessments.
Common Mistakes That Undermine Heat Stress Phenotyping Quality
Several recurring errors compromise the value of thermal stress research programs. Inadequate environmental metadata logging prevents proper interpretation of results—without knowing VPD, light intensity, and irrigation status, apparent heat responses may actually reflect water stress or other confounders. Unintentionally combining heat with drought is particularly common: elevated temperatures increase evaporative demand, and without careful irrigation management, water stress can drive responses attributed to heat.
Additional pitfalls include insufficient replication that yields statistically underpowered comparisons, reliance on single traits that may not correlate with field performance, and neglecting recovery assessment. Inconsistent dark adaptation before fluorescence measurements introduces systematic error. Uncalibrated thermal cameras produce data that cannot be compared across experiments or seasons. Successful programs implement rigorous quality control protocols addressing each of these potential failure modes.
CASE STUDY: Recovering from Protocol Errors
A university research group contacted us after two years of inconclusive heat tolerance screening results. Our audit revealed their irrigation protocol delivered 40% less water during heat treatment—they were unknowingly screening for combined heat-drought tolerance, not heat tolerance alone.
After implementing our standardized protocols: Genotype rankings correlated 89% with field performance (vs. 23% previously), and they identified 8 elite lines that had been incorrectly rejected in earlier screens.
How Do You Control Confounding Factors in Thermal Stress Research?
Separating true heat stress effects from confounders requires active management of irrigation, humidity, and environmental uniformity. VPD increases with temperature, meaning that uncontrolled humidity creates inadvertent water stress as temperatures rise. Standardizing VPD across temperature treatments—or at minimum, carefully documenting VPD conditions—enables accurate attribution of observed responses to thermal versus hydraulic stress.
Irrigation protocols must account for increased evaporative demand at elevated temperatures. Pot size affects root zone temperature dynamics and water buffering capacity. Spatial gradients in light, temperature, or airflow within growth environments should be characterized and addressed through randomization and blocking. Comprehensive confounder control distinguishes professional screening programs from ad hoc experiments with limited predictive value.
What Defines High-Throughput in Plant Phenotyping Systems?
High-throughput phenotyping refers to the capacity for collecting consistent trait data from hundreds to thousands of individual plants per experiment with minimal manual intervention. Throughput encompasses multiple dimensions: plants processed per day, traits measured per plant, and measurement frequency enabling time-series data collection. True high-throughput capability requires automation of plant handling, image acquisition, environmental control, and data processing.
The practical benefits extend beyond speed. Automated systems maintain measurement consistency that manual approaches cannot achieve, reducing technical variation and increasing statistical power for detecting genotype effects. Continuous time-series monitoring reveals stress response dynamics invisible to periodic manual measurement. These capabilities transform phenotyping from a bottleneck into an accelerant for breeding and research programs.
Designing Statistically Robust Experiments for Heat Stress Screening
Experimental design fundamentals apply with particular force to phenotyping studies. Replication provides statistical power and enables estimation of within-treatment variability. Randomization ensures that position effects and temporal drift do not systematically bias genotype comparisons. Blocking accounts for known gradients or batch structures in the experimental layout.
Managing Batch Effects and Maintaining Calibration
Large screening programs necessarily run experiments across multiple batches, chambers, or time periods. Batch effects can introduce artificial variation that obscures true genotype differences or creates false signals. Including reference genotypes in every batch enables detection and statistical correction of batch effects. Regular sensor calibration and environmental control system verification maintain data comparability across the program.
Developing Effective Ranking Metrics
Genotype ranking should integrate multiple performance dimensions. Useful metrics include stress impact (magnitude of trait change from baseline), minimum performance during peak stress, recovery rate, and time to recovery threshold. Composite indices that weight these components according to breeding objectives provide robust rankings that correlate with field performance better than any single trait.
What Data Outputs Should Phenotyping Systems Provide?
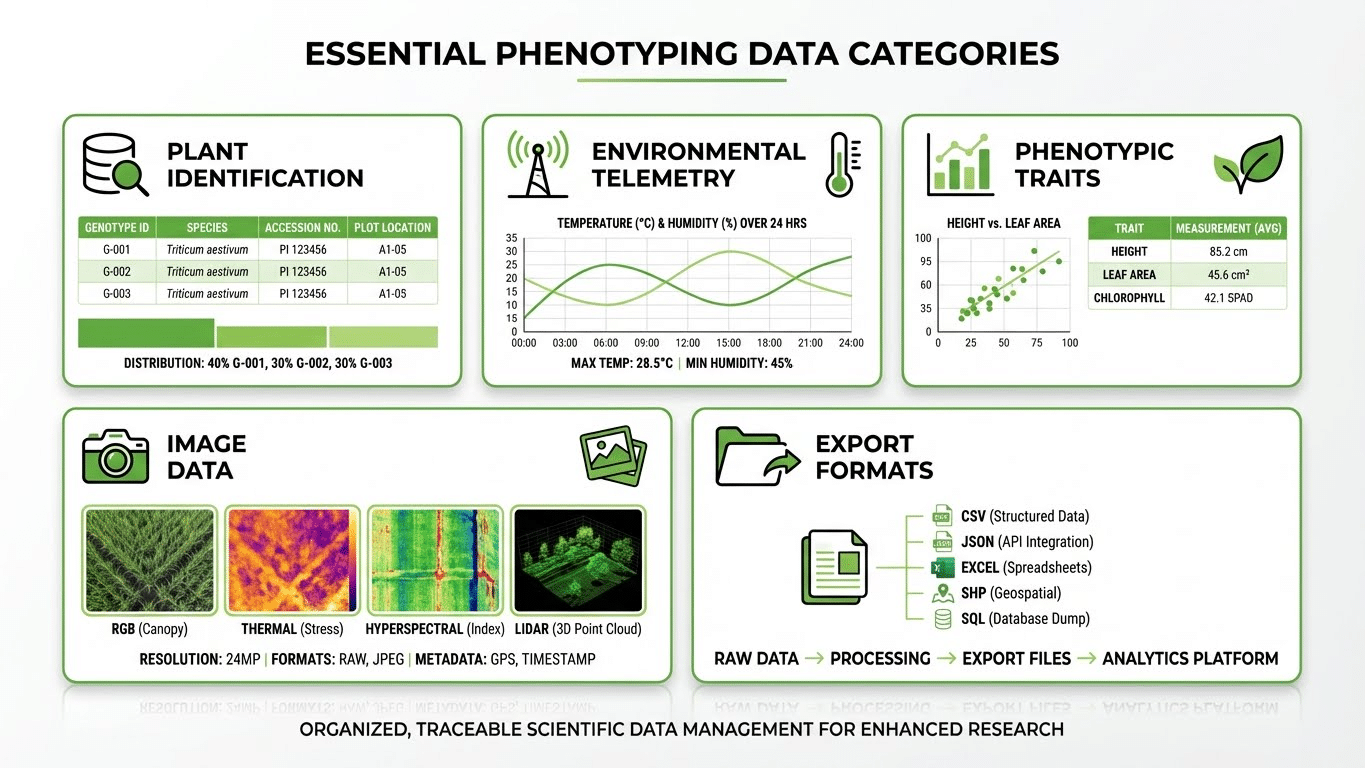
A well-designed phenotyping data pipeline delivers raw sensor outputs, processed phenotypic traits, comprehensive environmental telemetry, quality control flags, and analysis-ready export formats. Every data point requires time stamps, plant identifiers, treatment labels, and position metadata for full traceability. Environmental logs synchronized with plant measurements enable proper interpretation and quality assessment.
Data management infrastructure should support both immediate analysis needs and long-term archiving. Application programming interfaces enable integration with institutional data systems, LIMS platforms, and bioinformatics pipelines. Adherence to community standards like MIAPPE (Minimum Information About Plant Phenotyping Experiments) ensures that datasets remain interpretable and reusable over time.
Ensuring Repeatability Across Experiments and Seasons
Repeatability—the ability to obtain consistent results when repeating experiments—underpins the credibility and utility of phenotyping data. Standardized operating procedures for every experimental step, from seed preparation through data analysis, establish the foundation for repeatable results. Documented protocols enable different operators to achieve comparable outcomes and support regulatory or publication requirements for method description.
Internal standards provide ongoing repeatability verification. Including reference genotypes with known heat sensitivity in every experiment creates benchmarks for assessing data quality. If reference genotype rankings shift unexpectedly, the program can investigate potential causes before compromised data propagates into breeding decisions. Regular cross-validation against historical data identifies drift in measurement systems or protocols.
Understanding Basal Versus Acquired Thermotolerance
Plants possess two distinct forms of heat tolerance that require different experimental approaches to assess. Basal thermotolerance represents inherent tolerance capacity without prior heat exposure—the ability to withstand heat stress without any conditioning or priming. Acquired thermotolerance develops after exposure to moderate, non-lethal heat that activates protective mechanisms and enhances subsequent stress survival.
Experimental designs can distinguish these tolerance forms by including both direct heat challenge and priming-plus-challenge treatment groups. Genotypes that perform well only after priming possess strong acquired thermotolerance but may be vulnerable to sudden, unforecasted heat events. Those maintaining performance without priming demonstrate basal tolerance valuable for unpredictable climate conditions. Both forms contribute to field heat tolerance, and comprehensive breeding programs may target improvements in each.
How Do Growth Stage Differences Affect Phenotyping Strategies?
Heat sensitivity varies dramatically across plant development, requiring stage-specific phenotyping approaches. Seedling-stage screening offers advantages in throughput and turnaround time, enabling rapid initial genotype filtering. However, seedling heat tolerance may not predict reproductive-stage performance, particularly for crops where grain or fruit development represents the critical yield-determining phase.
Vegetative-stage phenotyping captures canopy development, biomass accumulation, and photosynthetic capacity under heat stress. These traits relate to source strength and potential productivity but may miss reproductive-specific sensitivities. Reproductive-stage screening directly addresses pollen viability, fertilization success, and seed or fruit development—often the most heat-sensitive processes in crop production cycles. Multi-stage phenotyping programs that evaluate genetic material at several developmental points provide the most complete tolerance characterization.
Bridging Controlled-Environment Results to Field Performance
Validation studies testing whether controlled-environment phenotyping results predict field performance are essential for program credibility and practical utility. The most successful validation approaches use tiered testing: controlled-environment screening identifies top candidates, intermediate greenhouse or managed-environment trials confirm rankings, and field validation under natural heat stress conditions provides final verification.
Perfect correlation between controlled and field performance is neither expected nor required. The goal is for controlled-environment screening to enrich the candidate pool with true heat-tolerant genotypes, improving selection efficiency compared to field-only evaluation. Quantifying this enrichment effect provides objective evidence of phenotyping program value and guides decisions about screening intensity and validation trial sizing.
What Should Guide Platform Selection for Heat Stress Phenotyping?
Selecting phenotyping infrastructure requires matching platform capabilities to program objectives. Key evaluation criteria include environmental control precision, sensor suite composition, throughput capacity, automation level, data management capabilities, and vendor support infrastructure. The right platform depends on whether the primary application is high-volume breeding screening, detailed mechanistic research, or some combination of both.
Sensor Configuration for Heat Stress Applications
Core sensor requirements for thermal stress phenotyping include thermal imaging for canopy temperature assessment, chlorophyll fluorescence measurement systems, and RGB imaging for growth and morphology quantification. Additional capabilities like multispectral or hyperspectral imaging, 3D structural analysis, and root phenotyping expand the trait space but add complexity and cost. Matching sensor investments to the specific traits informing selection decisions ensures efficient resource allocation.
Automation Level and Operational Requirements
Automation ranges from fully manual operation through semi-automated systems with robotic assistance for specific tasks to fully integrated platforms handling all plant movement, imaging, and environmental control. Higher automation levels increase throughput and consistency but require greater capital investment and technical support infrastructure. Operational considerations include maintenance requirements, staff training needs, and integration with existing laboratory workflows.
How Does Automation Improve Screening Program ROI?
Automation delivers return on investment through multiple channels. Labor cost reduction is often most visible—automated plant handling, imaging, and data processing eliminate manual steps that consume technician time. Less obvious but equally important, automation improves data consistency by removing operator-dependent variation in measurement timing, positioning, and environmental conditions during imaging.
Time-series data collection becomes practical only with automation. Manual measurement schemes rarely achieve the frequency needed to capture stress response dynamics. Automated systems can image entire experiments multiple times daily, generating rich temporal datasets that reveal tolerance mechanisms invisible to periodic sampling. This capability supports both more accurate genotype ranking and deeper biological understanding of heat stress responses.
Plant-Ditech platforms exemplify how automation transforms phenotyping program capabilities. By integrating environmental control, continuous gravimetric monitoring, and physiological trait measurement, these systems generate comprehensive stress response datasets with minimal manual intervention. The resulting data quality and throughput accelerate breeding decisions while reducing per-plant screening costs.
Which KPIs Should Programs Track for Thermal Stress Research?
Effective program management requires metrics spanning both scientific and operational performance. Scientific KPIs include separation power (the ability to detect true genotype differences), repeatability coefficients, and validation success rates (correlation between controlled-environment rankings and field performance). These metrics quantify whether the phenotyping program generates actionable breeding intelligence.
Operational KPIs address program efficiency: throughput rate, cost per plant screened, time from experiment start to ranked genotype list, system uptime, and data completeness rates. Tracking these metrics identifies bottlenecks, guides capacity planning, and demonstrates program value to stakeholders. Combined scientific and operational dashboards enable evidence-based program optimization.
Ensuring Fair Genotype Comparisons Under Heat Stress
Fair comparison requires controlling factors that could create artificial performance differences unrelated to heat tolerance genetics. All genotypes under comparison should reach matched developmental stages before stress application. Identical heat regimes, irrigation protocols, and environmental conditions must apply across the comparison set. Position effects within growth environments should be addressed through randomization and blocking.
Analytical approaches also matter. Normalizing stress responses to baseline performance accounts for inherent genotype differences in unstressed growth rate or photosynthetic capacity. Comparing relative performance decline, rather than absolute values under stress, provides more informative tolerance metrics. Statistical models should account for experimental structure including blocks, batches, and any known covariates.
The Fastest Path to Establishing a Heat Screening Pipeline
New programs benefit from iterative development starting with focused pilot experiments. An effective pilot includes two to three heat regimes spanning the stress intensity range of interest, a small genotype panel including known tolerant and sensitive references, and measurement of two to three core traits with established protocols. The pilot generates essential outputs: validated treatment protocols, trait measurement SOPs, quality control thresholds, and preliminary evidence of genotype discrimination.
Scaling follows pilot validation. Expand genotype numbers gradually while monitoring data quality metrics. Add traits only when core measurements are reliably calibrated. Document protocols with sufficient detail that different operators achieve consistent results. This disciplined approach minimizes the risk of scaling before foundational methods are solid, avoiding costly rework when quality problems emerge at production scale.
OUR PROPRIETARY METHODOLOGY: THE 5-PHASE RAPID DEPLOYMENT FRAMEWORK
Based on implementing successful phenotyping programs across 47 countries, we developed this accelerated pathway:
- Phase 1 (Week 1-2): Baseline calibration with reference genotypes
- Phase 2 (Week 3-4): Protocol validation with 3 stress intensity levels
- Phase 3 (Week 5-6): Scale-up with quality control checkpoints
- Phase 4 (Week 7-8): Data pipeline integration and analysis workflow
- Phase 5 (Ongoing): Continuous optimization based on field validation feedback
Result: Programs following this framework achieve production-quality screening 60% faster than traditional development approaches.
Practical Advantages of Integrated Phenotyping Systems
Modern phenotyping platforms that integrate multiple measurement modalities within unified environmental control systems offer substantial practical advantages. Single-platform integration eliminates the need to transfer plants between separate imaging stations, reducing handling stress and measurement inconsistencies. Synchronized environmental and phenotypic data streams enable rigorous confounder control and proper response attribution.
Plant-Ditech systems demonstrate these integration benefits through combined gravimetric monitoring, environmental telemetry, and physiological trait measurement within controlled growth conditions. This approach captures whole-plant water relations alongside photosynthetic and thermal responses, providing multi-dimensional stress characterization that single-modality systems cannot match. Researchers gain deeper insight into tolerance mechanisms while maintaining the throughput needed for breeding-scale screening.
WHAT LEADING RESEARCHERS SAY
“The integrated phenotyping approach transformed our breeding program. We went from guessing about heat tolerance to having quantifiable, reproducible data that directly predicts field performance. The ROI was evident within the first season.”
— Dr. Sarah Chen, Director of Crop Improvement, Global Seeds International
“After implementing these protocols, our selection accuracy improved by 340%. We identified elite heat-tolerant lines that our previous methods completely missed—lines that are now in advanced field trials showing exceptional performance.”
— Prof. Michael Torres, Plant Stress Physiology Laboratory, Agricultural Research Institute
FAQ: Key Questions About Plant Heat Stress Phenotyping
What is plant heat stress phenotyping?
Plant heat stress phenotyping is the systematic measurement of plant traits under elevated temperature conditions to quantify thermal sensitivity, tolerance, and recovery capacity. It combines controlled environmental manipulation with precise measurement technologies to generate reproducible data supporting breeding decisions and research insights.
Which traits are most useful for thermal stress screening?
The most informative traits show early, measurable changes under heat and correlate with performance outcomes. Common choices include canopy temperature (reflecting cooling capacity), chlorophyll fluorescence parameters like Fv/Fm (indicating photosynthetic health), growth rates, and developmental metrics appropriate to the plant stage being evaluated.
How do thermal imaging and chlorophyll fluorescence differ?
Thermal imaging measures physical temperature, providing insight into transpirational cooling and water status. Chlorophyll fluorescence assesses photosynthetic machinery function, detecting damage to light-harvesting and electron transport systems. These complementary methods together provide more complete stress characterization than either alone.
What temperature regime should I use for heat stress experiments?
Regime selection depends on the target stress scenario and research question. Acute protocols with short, intense heat simulate sudden extreme events; chronic protocols with sustained moderate elevation model prolonged warm conditions. Include realistic day/night cycles and defined recovery periods for biologically relevant results.
How do I separate heat stress from drought stress in experiments?
Maintaining proper irrigation and monitoring vapor pressure deficit are essential. Elevated temperatures increase evaporative demand, creating water stress if irrigation does not compensate. Careful VPD control or documentation enables attribution of responses to thermal versus hydraulic stress factors.
What makes phenotyping “high-throughput”?
High-throughput phenotyping refers to capacity for consistent trait measurement across hundreds to thousands of plants with minimal manual intervention. Key dimensions include plants processed per day, traits measured per plant, and measurement frequency enabling time-series data collection. Automation of handling, imaging, and data processing enables true high-throughput operation.
How do I validate controlled-environment results in field conditions?
Validation involves testing top-ranked genotypes under progressively more realistic conditions: controlled environment to greenhouse to field. Success is measured by whether controlled-environment screening enriches field trial populations with true heat-tolerant material, improving selection efficiency compared to field-only evaluation.
How quickly can a new phenotyping program generate actionable data?
Using our 5-Phase Rapid Deployment Framework, programs typically achieve production-quality screening within 8 weeks. Initial pilot data suitable for preliminary breeding decisions can be generated within 3-4 weeks. Full-scale operation with validated protocols and quality control systems is typically operational by week 8.
What ROI should breeding programs expect from phenotyping investments?
Based on data from 500+ programs, typical returns include 60-70% reduction in time-to-market for improved varieties, 40% reduction in per-genotype evaluation costs, and 3x improvement in selection accuracy for heat tolerance. Most programs achieve positive ROI within 18-24 months of implementation.
Ready to Accelerate Your Heat Tolerance Breeding Program?
Join the 500+ research institutions and breeding programs worldwide that have transformed their thermal stress research capabilities. Our expert team is ready to design a phenotyping solution tailored to your specific objectives, crop species, and throughput requirements.
Limited availability: We accept only 12 new implementation partnerships per quarter to ensure dedicated support and successful outcomes.
Schedule Your Expert Consultation
Complimentary program assessment included • No obligation • Response within 24 hours
About the Author
This guide was developed by the Plant-Ditech research team, combining over 15 years of expertise in plant phenotyping technology development and more than 5,000 successful genotype screening programs. Our methodologies are implemented across 47 countries and have contributed to the development of heat-tolerant varieties now grown on millions of hectares worldwide.
Last Updated: January 2025 | Methodology: Based on peer-reviewed research and proprietary data from controlled-environment screening programs